AI-translated. Read the original in KoreanEmbedded slides, videos and images remain in their original language.
What Filled Our MemoryDB? Part 1: Client-Side Caching and Tracking Items

Software Engineer
Hello, I'm Simon Lee, a server engineer on the Ad Allocation Systems team.
Recently, memory usage in our team's MemoryDB (Redis) reached 85%, leaving less than 500 MB available. This is the story of finding what occupied that memory and recovering more than 3 GB of headroom. Part 1 covers the investigation; Part 2 covers the solution.
Why do we use MemoryDB?
Our team operates the system that decides which ads to show when a user enters a Buzzvil placement. Which ads will interest that user? We need to consider who they are, which ads are currently available, and many other factors. We use AWS MemoryDB to read those details in real time for around 7,000 requests per second.
Why did we start digging into MemoryDB?
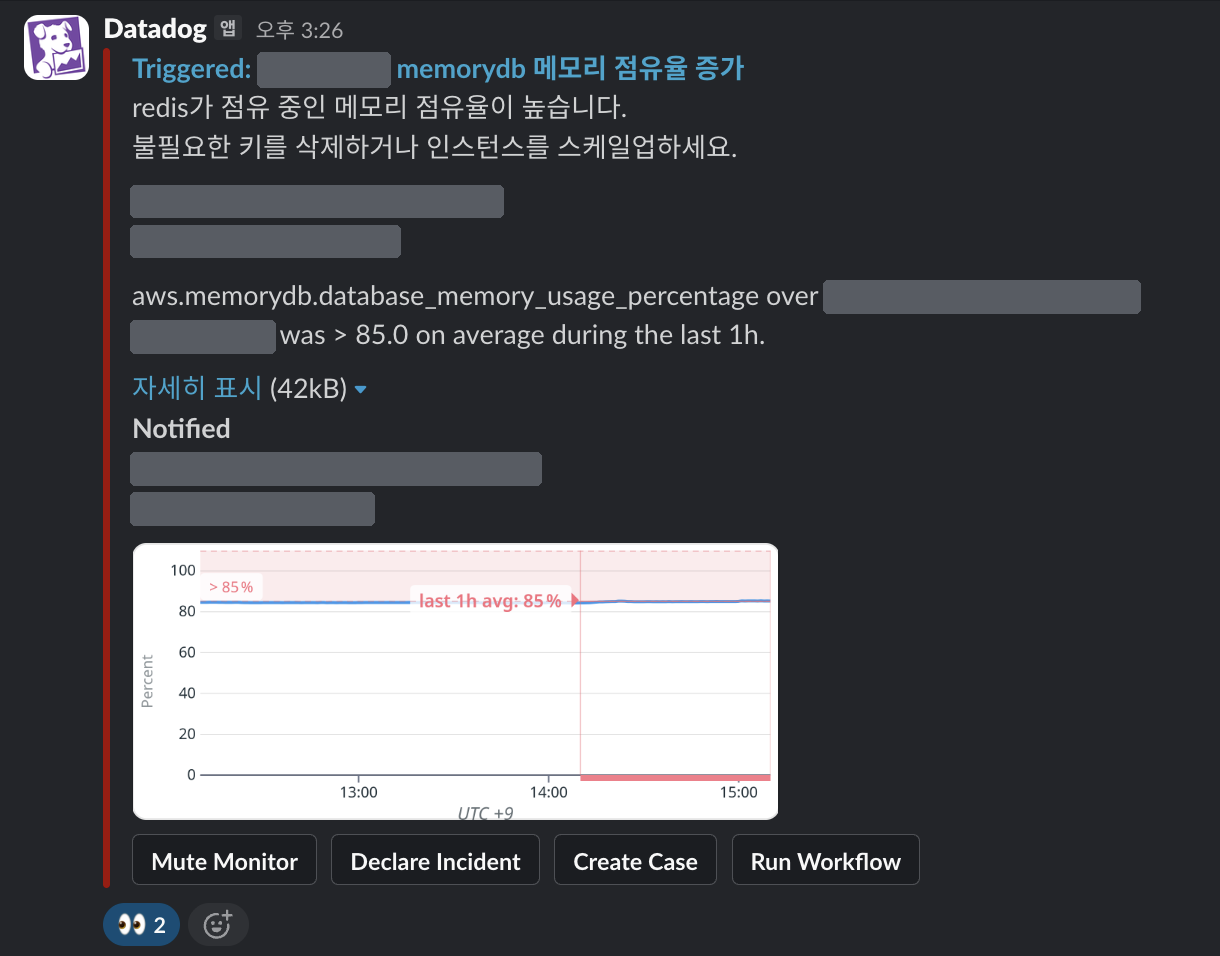
One day, we received an alert that MemoryDB memory usage had reached 85%. Scaling up was an immediate option, but we had already done that once and applied several temporary measures afterward. Usage kept rising, so we wanted to find the underlying problem.
I was actually a junior engineer only six months into the job and knew little beyond MemoryDB's basic operation. Wanting to learn more, I confidently volunteered to take it on. At Buzzvil, people who step forward get plenty of opportunities.
Where did we start?
We began with the simplest possibility: were keys without TTLs accumulating? Unfortunately, checking the code did not reveal such keys.
Next, we inspected memory. We run one primary and one replica. Comparing them revealed something strange.

They replicate the same data, yet the primary used 85% (2.63 GB) and the replica only 30% (0.96 GB). If they hold the same data, shouldn't those numbers match? We began investigating one possibility at a time.
Hypothesis 1: the primary has more overhead? Rejected.

The primary handles client writes and replication, so perhaps its additional responsibilities meant more overhead. But client buffers and replication backlog totaled only 34 MB on the primary and 21 MB on the replica—far too small a difference to explain a gap above 1.6 GB.
Hypothesis 2: the primary contains more data? Rejected.

Could faulty replication have left more data on the primary? We counted all keys: 104,848 on the primary and 104,864 on the replica, essentially identical. Measuring the memory occupied by actual keys and values also gave roughly 165 MB on each.
Wait—only 165 MB of actual data? If the primary used 2.63 GB, what occupied the remaining roughly 2.5 GB? We opened the allocator statistics, MEMORY MALLOC-STATS.
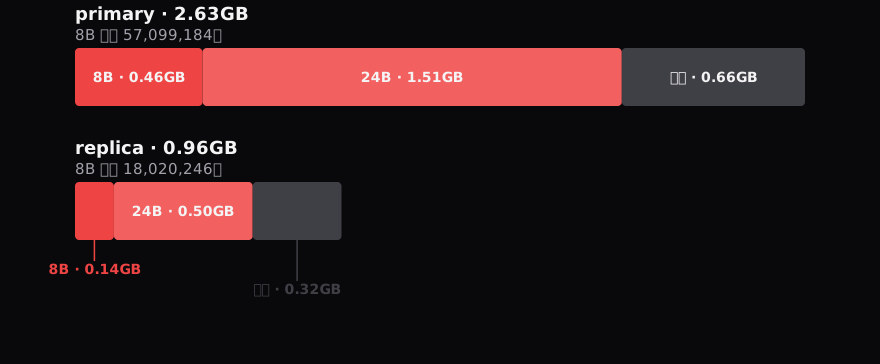
The primary had 57.09 million eight-byte objects; the replica had 18.02 million. There were also proportional numbers of 24-byte objects. On the primary, the eight-byte and 24-byte objects together occupied around 2.0 GB.
Our service data should not consist of such tiny objects, yet there were 57 million of them. We needed to identify them.
Redis has an INFO command that reports internal metrics, including memory and connections, as name: value. Could one of those numbers match 57.09 million?
tracking_total_items: 56,988,980
We found a metric within 0.2% of the 57,099,184 eight-byte objects. Finally, we seemed closer to the cause. Now we needed to understand what it represented.
tracking_total_items
What is a tracking item?
Since Redis 6, client-side caching has allowed clients to cache values locally instead of fetching them from Redis every time. To prevent stale values from being used, Redis tells a client when a cached key changes: “This value changed; invalidate your cached copy.”
To do that, Redis must remember which clients have read which keys. That registry is the Tracking Table, and each entry is a tracking item. tracking_total_items counts all key–client entries.

Internally, it uses a radix tree. The diagram records clients #1031002 and #1029744 reading w:KR-11, and clients #1030112 and #1024310 reading w:KR-26. Key names form the tree paths—the 24-byte intermediate nodes—with client IDs attached at the leaves, using eight bytes. That explains the object sizes we saw earlier.
When is a tracking item created?
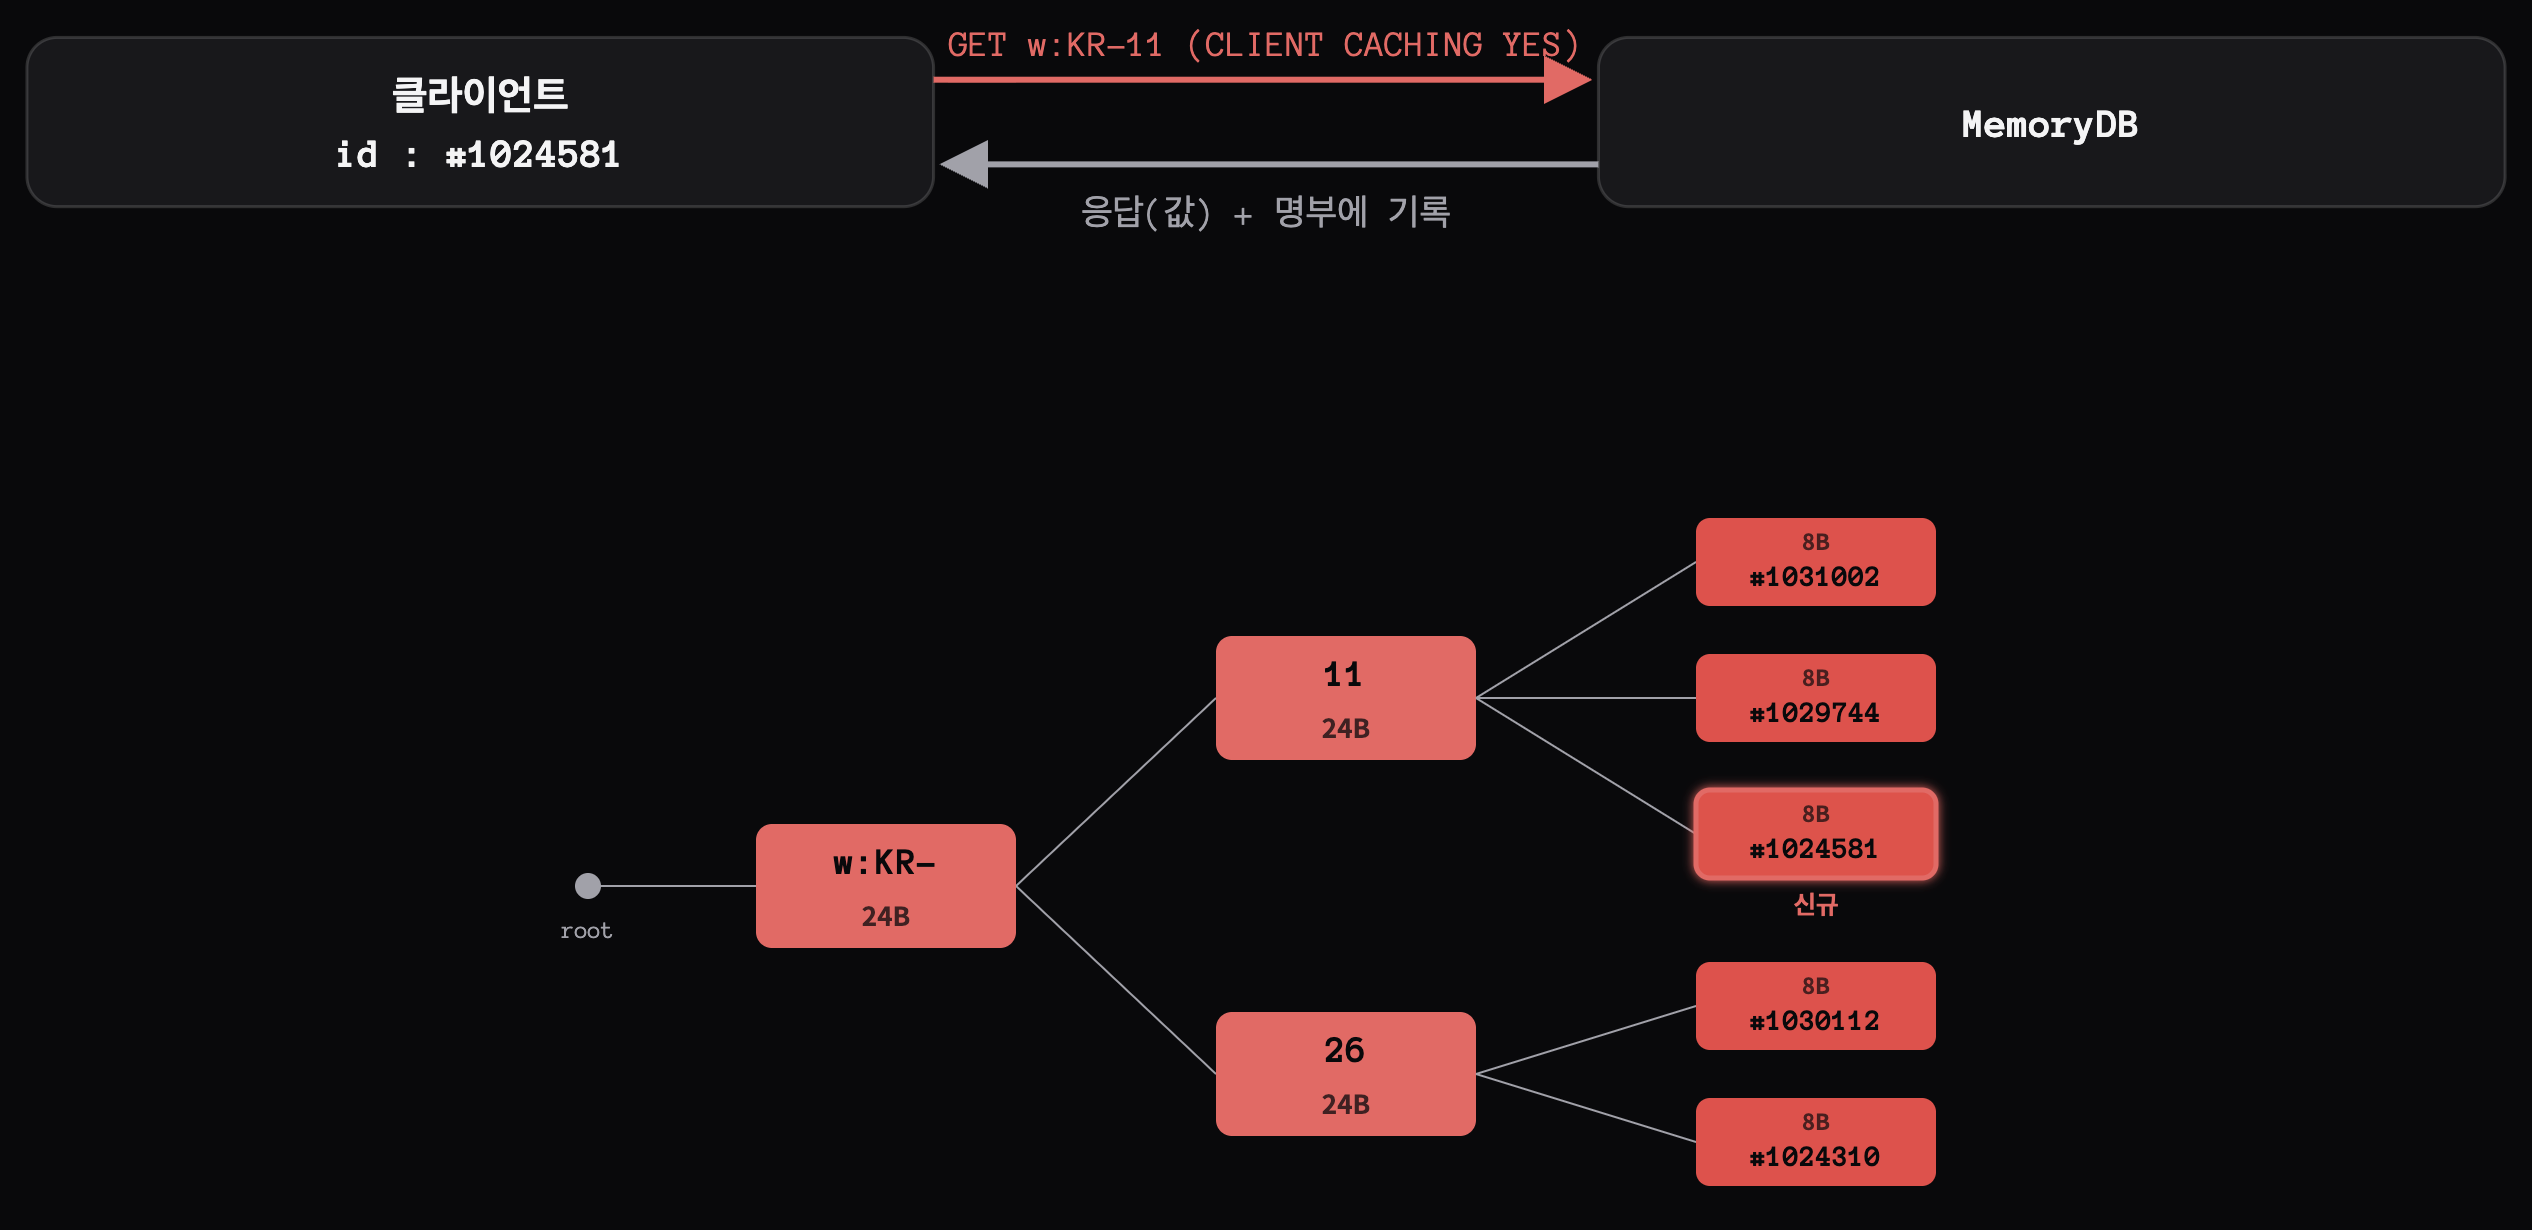
Each read of a key configured for client caching records a key–connection entry. Here, client #1024581 reads w:KR-11, adding its ID to the registry for that key.
When is it removed?
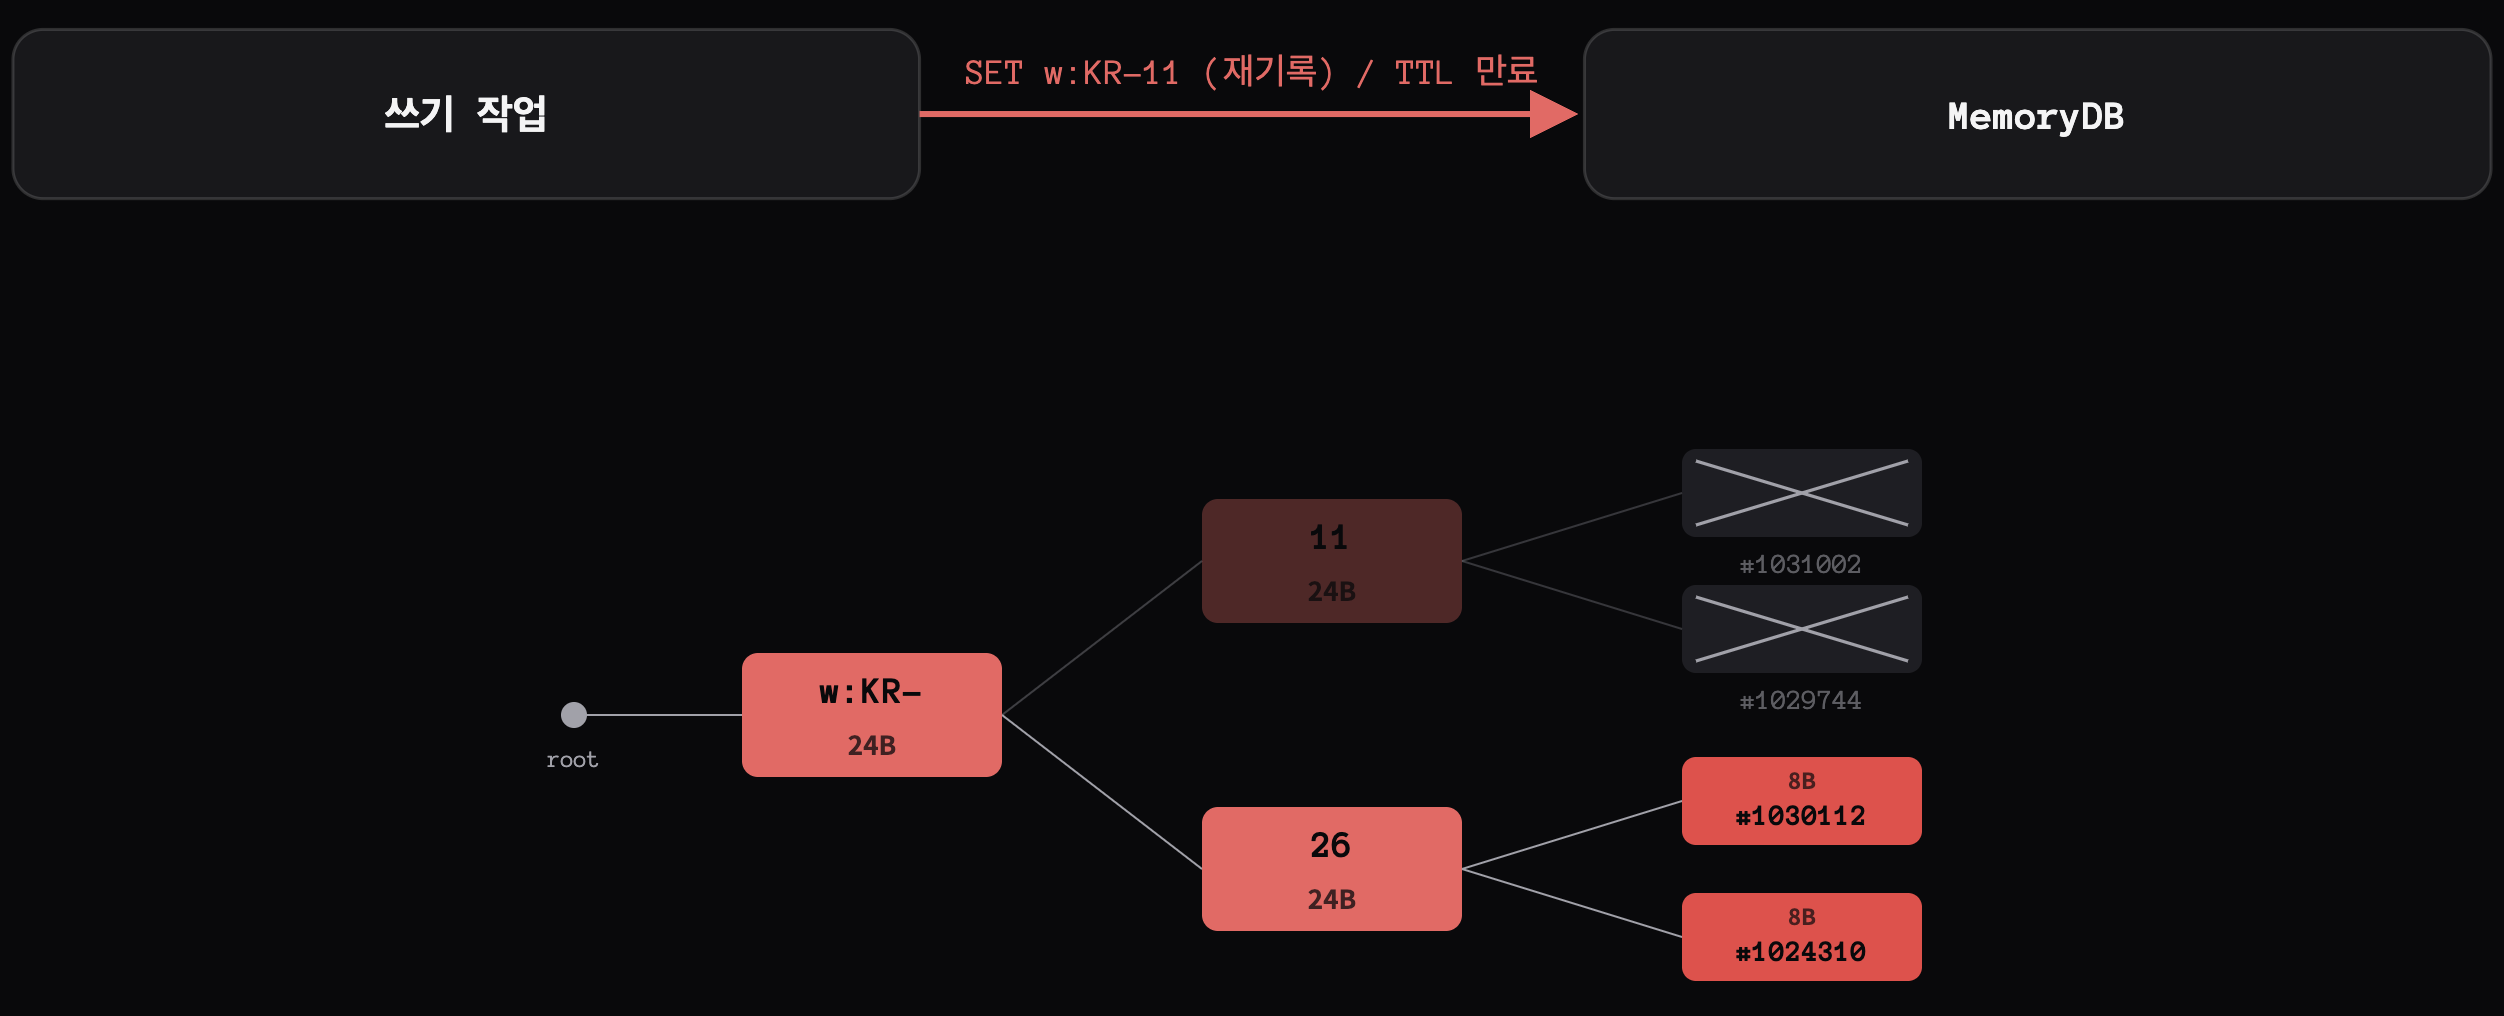
When a cached key is written to—its value changes, it is deleted, or its TTL expires—all tracking items for that key are reclaimed, and invalidation messages go to every client that read it.
So far, that makes sense. But what if a client disconnects? Since Redis can no longer send invalidations to it, one might expect its tracking entries to be removed. Yet a client's registry entries are not reclaimed when it disconnects. There is even a Redis GitHub issue about this. Is that intentional?
The invalidation code in Redis's source contains this comment:
"we'll remove the ID reference in a lazy way. Otherwise when a client with many entries in the table is removed, it would cost a lot of time to do the cleanup." — redis/src/tracking.c, disableTracking(), lines 64–66 in Redis 6.2
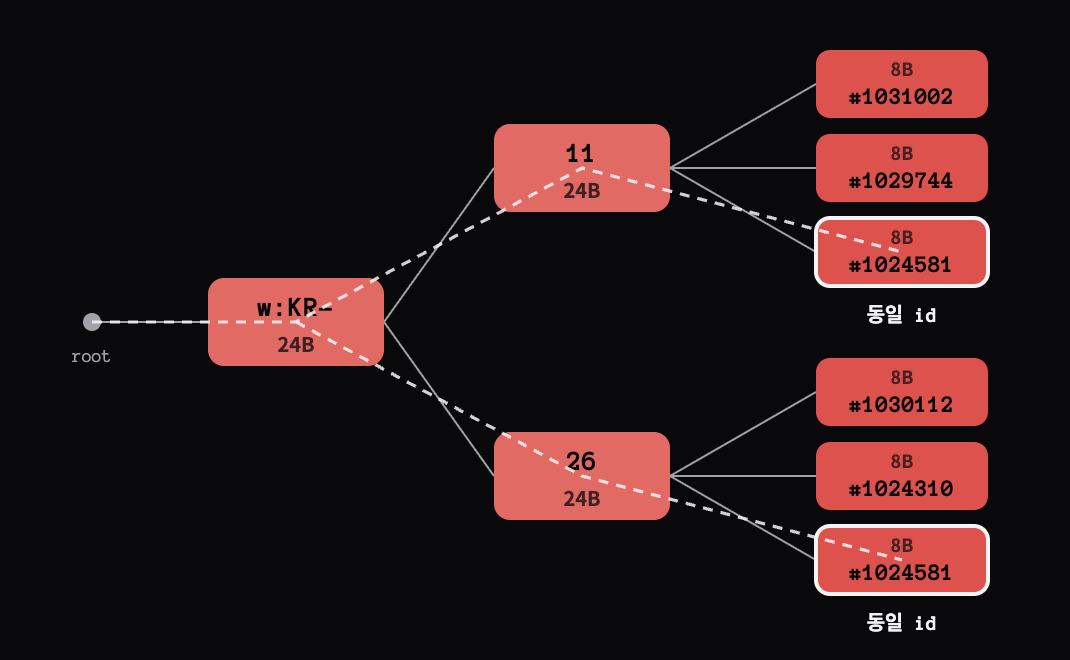
When a client that has cached many keys disconnects, finding its entries requires scanning the entire radix-tree Tracking Table. The diagram shows the scan for disconnected client #1024581. That is expensive, so the design defers removal until the key is invalidated later.
Deployments, scaling, and batch work create and close roughly 26,000 MemoryDB connections each day in our service, even though only about 500 are active at any given moment. Were departed clients' entries accumulating?
Testing live keys
These are the key patterns using client-side caching in our service.
| Key pattern | TTL | Purpose |
|---|---|---|
ab:__all_config__ | None | A/B experiment configuration |
unit_margin_rate_<id> | 72h | Placement margin rate |
{lineitem_margin_rate}:<id> | 72h | Ad margin rate |
w:<region> | 24h | Local weather for targeting |
best_product:<feed> | Recreated daily | Recommended product list |
Everything except ab:__all_config__ is cleaned up periodically. Could tracking items for that key be accumulating? We rewrote it with the same value to force invalidation.
Result: 991 entries reclaimed, approximately 33 KB.
We widened the experiment and invalidated every key individually.
Result: approximately zero entries reclaimed.
Live keys held almost no registry entries. There is also no way to inspect which keys remain in the tracking table or arbitrarily clean them up. If no currently used key was responsible, perhaps failing over to reclaim the accumulated items would stop the growth?
When had the accumulation started?
We analyzed 15 months of memory history in CloudWatch.
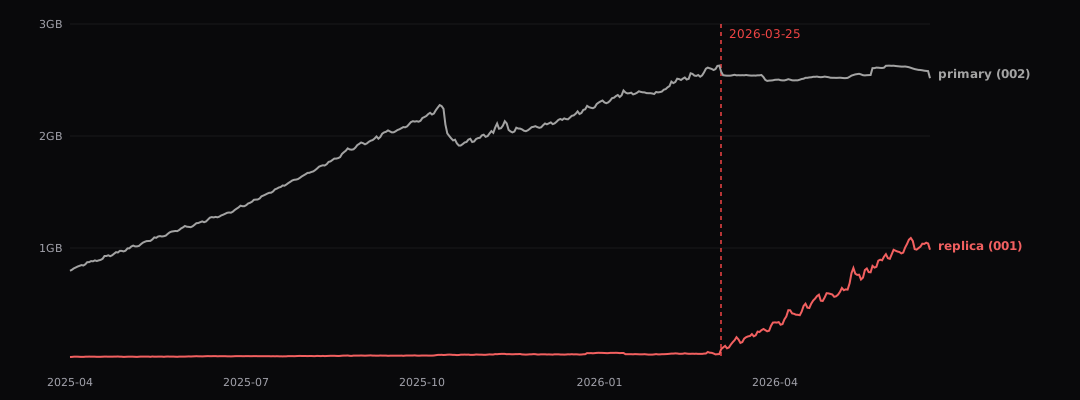
The primary grew linearly by about 0.2 GB per month, then stopped exactly on March 25, 2026. On that very day, the replica began growing instead—and continued through the present. A failover would therefore only leave us filling memory again.
Finding out what happened on March 25 looked like the way to uncover the real cause.
What happened that day?
March 25 was when we deployed a Redis client cleanup that moved reads from the primary to the replica. Four of the five client-cached key patterns moved too.
| Key pattern | TTL | Purpose | Read location |
|---|---|---|---|
ab:__all_config__ | None | A/B experiment configuration | Primary |
unit_margin_rate_<id> | 72h | Placement margin rate | Primary → Replica |
{lineitem_margin_rate}:<id> | 72h | Ad margin rate | Primary → Replica |
w:<region> | 24h | Local weather for targeting | Primary → Replica |
best_product:<feed> | Recreated daily | Recommended product list | Primary → Replica |
Tracking items record which clients read cached keys, so the registry lives wherever the reads happen. Accumulation had simply moved from primary to replica.
But that was still strange. Every moved key had a TTL or was recreated daily, and expiration should reclaim its tracking items. Why were entries still accumulating? Why had the primary stopped growing even though it retained the non-expiring ab:__all_config__? Unlike that fixed key, the other four patterns contained variable values such as <id> and <region>. That looked suspicious.
The real cause: ghost keys never expire
The answer was in the Redis source. trackingRememberKeys extracts key names from command arguments and records them directly. It does not check whether the key actually exists.

At first that sounds like a bug, but it is natural behavior. A client can cache the fact that a key does not exist. Redis must notify it if the key is later created, so recording it regardless of existence is the right design.
Now the answer was clear. Reading a ghost key that has never existed leaves tracking items. Because the key was never created, it can never expire. Unless someone writes to it, those entries are never invalidated.
Logs and metrics confirmed that our service was reading ghost keys. In the w:KR-<region> pattern, we repeatedly read w:KR- with the region missing.
For a final test, we wrote a value to w:KR- to force invalidation. 393,597 tracking items on the primary and 146,436 on the replica were reclaimed immediately. This single nonexistent key's tracking items occupied around 18 MB. We could not identify other ghost keys because they were not in the logs, but we had confirmed ghost-key reads as the cause.
Continued in Part 2
We had found the cause—but how did we solve it? Did we find every ghost key and prevent those reads? The improvements and retrospective continue in Part 2. Thank you for reading.