AI-translated. Read the original in KoreanEmbedded slides, videos and images remain in their original language.
How a DynamoDB Limit Setting Cut RCU Consumption by 97%

Server Engineer
Hello, I’m Jed from Buzzvil’s Supply Platform team.
Low latency and high availability matter when handling large volumes of traffic. That is why we make extensive use of DynamoDB and its promise of “Single-digit millisecond performance at any scale”.
In this post, I’ll walk through how we investigated a sharp increase in DynamoDB read capacity unit (RCU) consumption and found a solution. I hope it helps anyone facing a similar problem.
TL;DR
- Situation: RCU consumption rose from about 1k to 130k RCU/s—a 130-fold increase.
- Cause: No
Limit, combined with unnecessary strongly consistent reads.- Fix: Apply a
Limitand switch to eventually consistent reads.- Result: 87–97% lower RCU consumption.
Finding the problem and tracing its cause
1. Reports and metrics
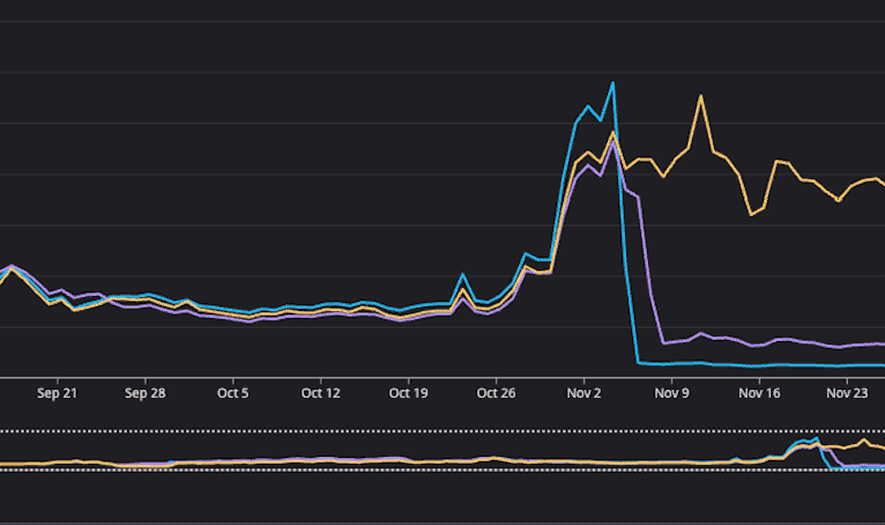
In early September 2025, a report from DevOps prompted a detailed investigation. We first examined RCU trends in Datadog and found a gradual increase beginning at a particular point in time.
# RCU 추이 (A 테이블 + C 테이블 합산)
2025-05-01: ~1k RCU/s
2025-05-23: ~6k RCU/s (점진적 증가 시작, A 테이블 ~5k + C 테이블 ~1k)
2025-09-04: ~35k RCU/s (리포팅 시점, A 테이블 ~15k + C 테이블 ~20k)
2025-10-30: ~130k RCU/s (대형 매체사 오픈 후 최고점, A 테이블 ~60k + C 테이블 ~70k)
2025-11-07: ~10k RCU/s (최적화 배포 후, A 테이블 ~8k + C 테이블 ~2k)
2. Following the trail
2.1 Daily RCU metrics
| Date | Average | Maximum | Morning | Afternoon | Notes |
|---|---|---|---|---|---|
| 01-15 | 241 | 573 | 300 | 270 | Stable |
| ... | ... | ... | ... | ... | ... |
| 05-23 | 1,790 | 4,330 | 1,000 | 3,000 | Usage increase |
| ... | ... | ... | ... | ... | ... |
| 10-27 | 11,800 | 23,800 | 16,000 | 10,000 | Peak |
The table helped us:
- Pinpoint the increase: usage crossed 2.5k RCU at around 2:10 p.m. on May 23.
- Identify patterns by time of day: consumption was higher from afternoon through evening.
- Share evidence: the team had a clear, concrete basis for discussion.
2.2 Automating deployment-history analysis
We used AI to analyze PRs and find correlations between deployments and the RCU increase. To compensate for AI’s nondeterministic behavior, we wrote a GitHub CLI script that produced an explicit, reproducible artifact.
# 특정 날짜의 배포에 포함된 PR 목록을 자동 추출

function find_deployments() {
    # ... 배포 조회
}

function find_merged_prs() {
    # PR 조회
    gh pr list --state merged --search "$sha" --base master \
        --json number,title | jq -r '.[] | @tsv'
}
The script automated what would have taken days of manual checking and quickly produced a shortlist of likely causes.
An aside: That same month, Nathan introduced Spec Driven Development (SDD). I was struck by how explicitly managing context in a specification could compensate for AI’s nondeterminism. Since then, I have used specifications to manage context when working with AI.
2.3 A deployment matrix across services
We cross-referenced deployments from January through September for the five services that queried the two tables directly.
| Date | Service A | Service B | Service C | Service D | Service E |
|---|---|---|---|---|---|
| 01-17 | #xxx | ||||
| ... | ... | ... | ... | ... | ... |
| 03-18 | #xxc | ||||
| ... | ... | ... | ... | ... | ... |
| 05-23 | #xxa | #xxb | |||
| ... | ... | ... | ... | ... | ... |
| 09-04 |
3. Finding a suspicious PR
The matrix pointed to a Service C PR merged on March 18. Reviewing it revealed two problems:
- No Limit: the query traversed the entire partition, averaging 300 items.
- Strongly consistent reads had been added: these consumed twice the RCUs of eventually consistent reads.
// 문제의 코드
iter := r.table.Get("user_id", userID).
    Order(dynamo.Descending).
    Consistent(true).  // 문제 2: Strong Consistent Read
    Iter()             // 문제 1: Limit 없이 전체 순회
Q: If the change was merged in March, why did we only discover it in September?
A: The change introduced a latent problem. As traffic grew gradually, the symptoms became noticeable in September. Then a major publisher launch in late October sharply increased traffic, turning it into a substantial cost issue.
To verify that these two changes really caused the RCU surge, we needed to understand how DynamoDB Query works.
How DynamoDB Query works
1. Inside the Query API
The DynamoDB Query API works as follows:
- Paging in 1 MB units: one Query call returns at most 1 MB of data (“a maximum of 1 MB”).
- What Limit means: the maximum number of items to evaluate, applied before filtering.
- How RCUs are calculated: based on the amount of data read, not the data ultimately returned.
| Read type | RCUs per 4 KB |
|---|---|
| Eventually consistent | 0.5 RCU |
| Strongly consistent | 1 RCU |
DynamoDB rounds item sizes up to 4 KB units when calculating RCUs.
Our partitions averaged about 300 items, each around 400 bytes. With each request able to read up to 1 MB, it could read the entire partition, averaging 120 KB (400 bytes × 300 items).
2. The guregu/dynamo library
Buzzvil makes extensive use of guregu/dynamo. Here are its main advantages over using the AWS SDK directly.
2.1 Struct Binding
AWS SDK
// 필드별 수동 타입 변환 필요
output, _ := client.GetItem(&dynamodb.GetItemInput{...})
if v, ok := output.Item["UserID"]; ok && v.N != nil {
    user.UserID, _ = strconv.Atoi(*v.N)  // 각 필드마다 반복...
}
guregu/dynamo
type User struct {
    UserID    int       `dynamo:"UserID,hash"`
    CreatedAt time.Time `dynamo:",unixtime"`
}

// 타입 안전성과 자동 직렬/역직렬화
err := table.Get("UserID", 123).One(&user)
2.2 Chainable API
AWS SDK
 // Expression 문자열 + AttributeValues 맵 조합
input := &dynamodb.QueryInput{
    KeyConditionExpression:   aws.String("UserID = :uid AND #time >= :t"),
    ExpressionAttributeNames: map[string]*string{...},  // 예약어 이스케이프
    ExpressionAttributeValues: map[string]*dynamodb.AttributeValue{...},
}
result, err := client.Query(input)
guregu/dynamo
// 메서드 체이닝으로 직관적 표현
err := table.Get("UserID", 613).
    Range("Time", dynamo.GreaterOrEqual, "2025-01-01").
    Order(dynamo.Descending).Limit(10).All(&results)
2.3 Pagination abstraction: where the missing Limit began
AWS SDK
// LastEvaluatedKey 루프를 직접 구현
for {
    output, err := client.Query(&dynamodb.QueryInput{ExclusiveStartKey: lastKey, ...})
    // ...
    if output.LastEvaluatedKey == nil { break }
    lastKey = output.LastEvaluatedKey
}
guregu/dynamo
iter := table.Get("UserID", 613).Iter()
for iter.Next(&result) {
	// 응답 처리
}
Both Iter() and All() inspect LastEvaluatedKey internally and traverse pages automatically.
The trap: Because Iter() lets you break out of a loop early, it is easy to assume that RCU consumption only covers the iterations you actually perform.
// 3번만 iteration하면 3개만 조회하는 것 아닌가?
iter := table.Get("UserID", 613).Iter()
for iter.Next(&result) {
    results = append(results, result)
    if len(results) >= 3 {
        break  // 여기서 끊으면 3개만 조회한 거 아닌가?
    }
}
Inside the library, however, Next() iterates over results fetched a page at a time.
// guregu/dynamo v1.20.2 query.go - NextWithContext (간략화)
func (itr *queryIter) NextWithContext(ctx context.Context, out interface{}) bool {
    // 1. 이미 조회한 결과가 있으면 버퍼에서 반환 (추가 Query 없음)
    if itr.output != nil && itr.idx < len(itr.output.Items) {
        itr.idx++
        return true
    }

    // 2. 버퍼가 비었으면 DynamoDB Query 실행 (여기서 RCU 소비!)
    itr.output, _ = client.QueryWithContext(ctx, itr.input)
    // ...
}
The first call to Next() executes a DynamoDB Query and fetches a full page, up to 1 MB. Later calls simply iterate over those already-fetched results. Even if you use only three items and then break, you have already consumed the RCUs for the entire page.
3. Passing Limit to the DynamoDB Query API correctly
3.1 The library implementation
guregu/dynamo exposes the DynamoDB Query API’s Limit parameter through two methods, Limit() and SearchLimit(). Both map to the same API parameter, but the conditions for passing it differ.
// guregu/dynamo v1.20.2 query.go - queryInput 메서드
func (q *Query) queryInput() *dynamodb.QueryInput {
    req := &dynamodb.QueryInput{...}
    // ...
    if q.limit > 0 {
        if len(q.filters) == 0 {  // ⭐ 필터가 없을 때만 전달
            req.Limit = &q.limit
        }
    }
    if q.searchLimit > 0 {
        req.Limit = &q.searchLimit // ⭐ 항상 전달
    }
    // ...
    return req
}
3.2 Pagination with Limit alone
With a filter, DynamoDB may evaluate n items but return fewer than n after filtering. The library therefore keeps fetching pages until the client has the requested number of items.
// guregu/dynamo v1.20.2 query.go:344-386 (간략화)
func (itr *queryIter) NextWithContext(ctx context.Context, out interface{}) bool {
    if limit 도달 (n개 수집 완료) { return false }
    if 현재 페이지에 아이템 남음 { return true }
    // SearchLimit: 추가 페이지 요청 X
    if 더 이상 페이지 없음 || searchLimit > 0 { return false }
	// Limit만 설정: 다음 페이지 요청 후 계속 반복
    itr.input.ExclusiveStartKey = itr.output.LastEvaluatedKey
}
The key distinction is that searchLimit > 0 stops after one API call. Otherwise, pagination continues until itr.n reaches limit.
3.3 Comparing pagination scenarios
Using Limit(10).Filter(...)
[1차] Limit 미전달 → 1MB까지 스캔 → 필터 후 3개 → "7개 더 필요" → 다음 페이지
[2차] Limit 미전달 → 1MB까지 스캔 → 필터 후 5개 → "2개 더 필요" → 다음 페이지
[3차] Limit 미전달 → 1MB까지 스캔 → 필터 후 4개 → "10개 도달!" → 중단

총 스캔: 최소 768개 → RCU 폭발 (아이템 4KB 이하 기준)
Using SearchLimit(10)
[1차] Limit=10 전달 → 10개만 스캔 → 끝

총 스캔: 10개 → RCU 절감 ✅
Limit vs SearchLimit
Method When Limit is sent Pagination behavior RCU impact Limit(n)When there is no filter Continues until n results Risk of reading the entire partition with a filter SearchLimit(n)Always Limits evaluation to n items Limits reads on the server Recommendation: Set
SearchLimitexplicitly when optimizing RCUs. WithLimitalone, the parameter may not reach the DynamoDB API if a filter is present, allowing the query to read the entire partition.
Choosing a solution
1. Understanding the business requirement
Choosing an appropriate limit required business context. Win, who had introduced this API to the publisher, explained the use case in detail.
The recent-history API’s actual use case:
- A user performs an action and a record is saved.
- After completing the action, the user is redirected to a results screen that displays the latest record.
2. Making a data-based decision together
Instead of guessing that “50 should be about right,” we chose the limit from real data. Win asked the DA team to analyze usage, giving us answers to specific questions:
- How many requests does a user make per session?
- How much headroom do we need at P95 and P99?
Analysis criteria, informed by domain knowledge:
- Session boundary: 30 minutes. A gap of at least 30 minutes starts a new session.
- Scope: high-traffic ad types.
Results:
| Metric | Value | Meaning |
|---|---|---|
| avg_requests_per_session | 5.33 | Average requests per session |
| median_requests_per_session | 3 | Median requests per session |
| p95_requests_per_session | 18 | 95% of sessions have 18 requests or fewer |
| p99_requests_per_session | 22 | 99% of sessions have 22 requests or fewer |
| avg_session_duration | 201.64 seconds | Average session duration, about 3.4 minutes |
| median_session_duration | 28.16 seconds | Median session duration |
How we derived the limit:
P99 = 22 요청/세션
  ↓
기본 Limit = 22 × 1.5 ≈ 33 (안전 마진)
  ↓
최대 Limit = 33 × 2 = 66 (엣지 케이스 대응)
Reading just 33–66 items would comfortably cover more than 99% of requests.
We documented the reasoning behind the magic number in a code comment. Otherwise, given enough time, nobody would remember why it was chosen.
Key insight: Actual usage showed that most lookups only needed recent records. Limiting the read range accordingly removed the need to read hundreds of items across an entire partition.
3. Quantifying the inefficiency
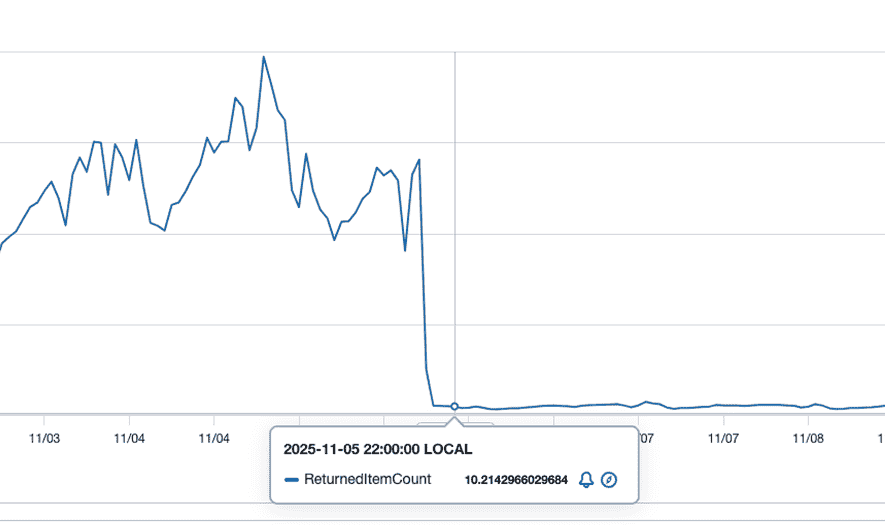
June pointed us to the AWS console’s “Query returned Item count” metric, which helped validate the problem.
# AWS 콘솔 DynamoDB 테이블 메트릭
Query returned Item count (평균): 270개/요청
Reading an average of 270 items per query for a use case that needed only 22 at P99 was a serious inefficiency. This metric became key evidence for quantifying its scale.
4. Revisiting consistency requirements
We examined whether strongly consistent reads were genuinely necessary.
| Step | Time |
|---|---|
| Action completed → API response | ~50 ms |
| Client redirect | ~200 ms |
| Results screen rendering | ~100 ms |
| Total delay | ~350 ms |
It takes about 350 ms for a user to see the results screen, longer than DynamoDB’s replication delay of a few hundred milliseconds. Eventually consistent reads were therefore sufficient for this use case.
The client also already retried up to three times, providing protection against briefly unavailable data.
Implementing the optimization
The key change: applying SearchLimit
iter := r.table.Get("user_id", userID).
    SearchLimit(limit).    // 핵심: 스캔 제한
    ConsumedCapacity(&cc). // RCU 모니터링
    Iter()

defer func() {
    if cc.Total > 1.5 { // 평균 아이템 사이즈 기반, 엣지 케이스 모니터링
        log.Info("DynamoDB RCU consumed", "total", cc.Total, "user_id", userID)
    }
}()
Expected RCU savings:
- Before: ⌈300 items × 400 B ÷ 4 KB⌉ × 1 = 30 RCU
- After: ⌈50 items × 400 B ÷ 4 KB⌉ × 0.5 ≈ 3 RCU, using a limit of 50, near the midpoint of the 33–66 range
- Expected reduction: about 90%
Results
1. Lower consumption
| Table | Metric | Before | After | Reduction |
|---|---|---|---|---|
| Table A | RCU | 60k/s | 8k/s | 87% |
| Table C | RCU | 70k/s | 2k/s | 97% |
2. Service quality
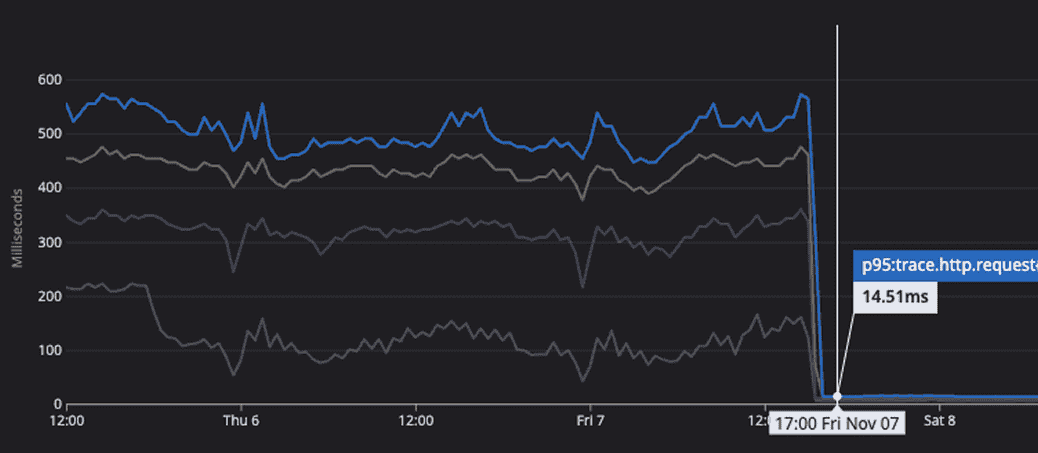
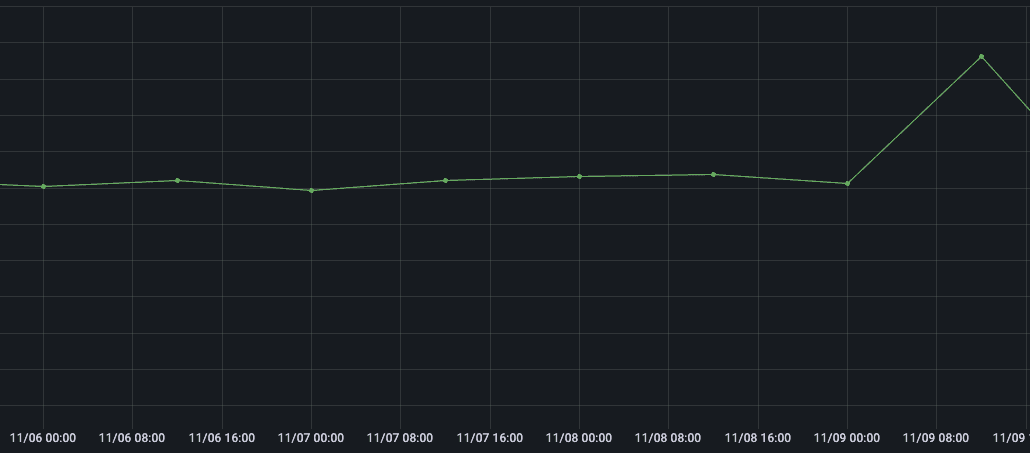
The query improvements substantially reduced response time while maintaining the API success rate.
Closing thoughts
We narrowed down the cause by normalizing metrics into daily tables and cross-referencing deployments in a matrix. AI-assisted scripting, June’s reporting and metric suggestions, Win’s business context, and the DA team’s analysis considerably shortened the investigation. Together, they led to a 97% reduction in RCUs.
If you use DynamoDB, review your Limit settings, ConsumedCapacity logging, and consistency options—strong versus eventual—to check that they fit your use case.
Appendix: a development trap—context.Canceled
The recent-history API queries two DynamoDB tables in parallel.
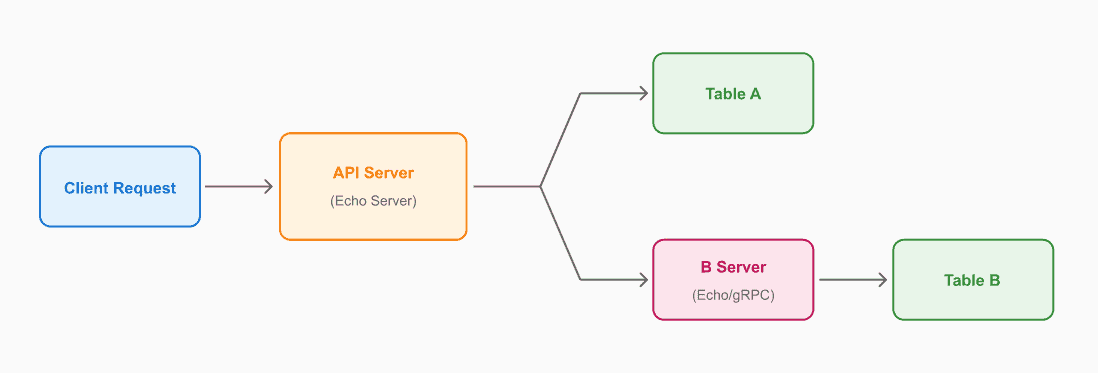
Both tables contain the same data, and the API returns the first successful result.
// 병렬 조회 패턴 (예시)
go func() { resultCh <- queryTableA(ctx, id) }()
go func() { resultCh <- queryTableB(ctx, id) }()

select {
    case r := <-resultCh: return r.Data  // 먼저 성공한 결과 반환
    case <-ctx.Done(): return ctx.Err()
}
Once one query succeeds, the other receives a context.Canceled error. This is expected behavior and needs to be excluded from monitoring errors. AWS SDK v1 in particular requires conversion to context.Canceled; Kun’s review helped us resolve that quickly. We applied these exceptions:
- Exclude
context.Canceledfrom error aggregation, such as Datadog. - Exclude
context.Canceledfrom alerts, such as Sentry. - With AWS SDK v1, convert
CanceledErrorCodetocontext.Canceled.
References
Official AWS documentation
- DynamoDB Read Consistency — Strong versus eventually consistent reads
- DynamoDB Query API — The Limit parameter and 1 MB pagination
- Read/Write Capacity Mode — How RCUs are calculated
- Best Practices for Querying — Query optimization guidance
Library
- guregu/dynamo v1.20.2 — The version analyzed here
- guregu/dynamo Query implementation — Limit versus SearchLimit logic