AI-translated. Read the original in KoreanEmbedded slides, videos and images remain in their original language.
From 245 Peak-Time Pods to Around 100: Halving Go Server CPU with DynamoDB SDK v2

Server Engineer
Three-point summary
- Pyroscope monitoring identified the paths consuming the most CPU.
- AWS SDK v1 unmarshalling beneath our DynamoDB wrapper was the cause; a major library upgrade addressed it.
- CPU per request fell 59%, and peak-time HPA desired pods dropped from 245 to 109.
The main Go application operated by our Supply group consistently scaled beyond 200 pods during the evening peak. With 70 million requests per hour at peak, we initially thought that pod count was reasonable. Profiling with Pyroscope revealed a CPU bottleneck in the DynamoDB client library, however. Upgrading the library alone reduced CPU per request by 59% and brought the pod count down to around 100. This post describes how we found the bottleneck and verified the improvement with real metrics.
The CPU bottleneck revealed by Pyroscope
When we examined the evening peak's CPU profile, guregu/dynamo stood out immediately. The DynamoDB lookup path occupied a broad section of the flame graph, with long chains of AWS SDK v1 JSON unmarshalling and reflection calls below it.
At first, we suspected the number of DynamoDB calls: the ad-serving API with the highest request volume uses DynamoDB extensively. But the flame graph showed little network I/O and clearly identified where CPU time was actually going. The absence of observed DynamoDB latency or throttling during that period also helped narrow the cause.
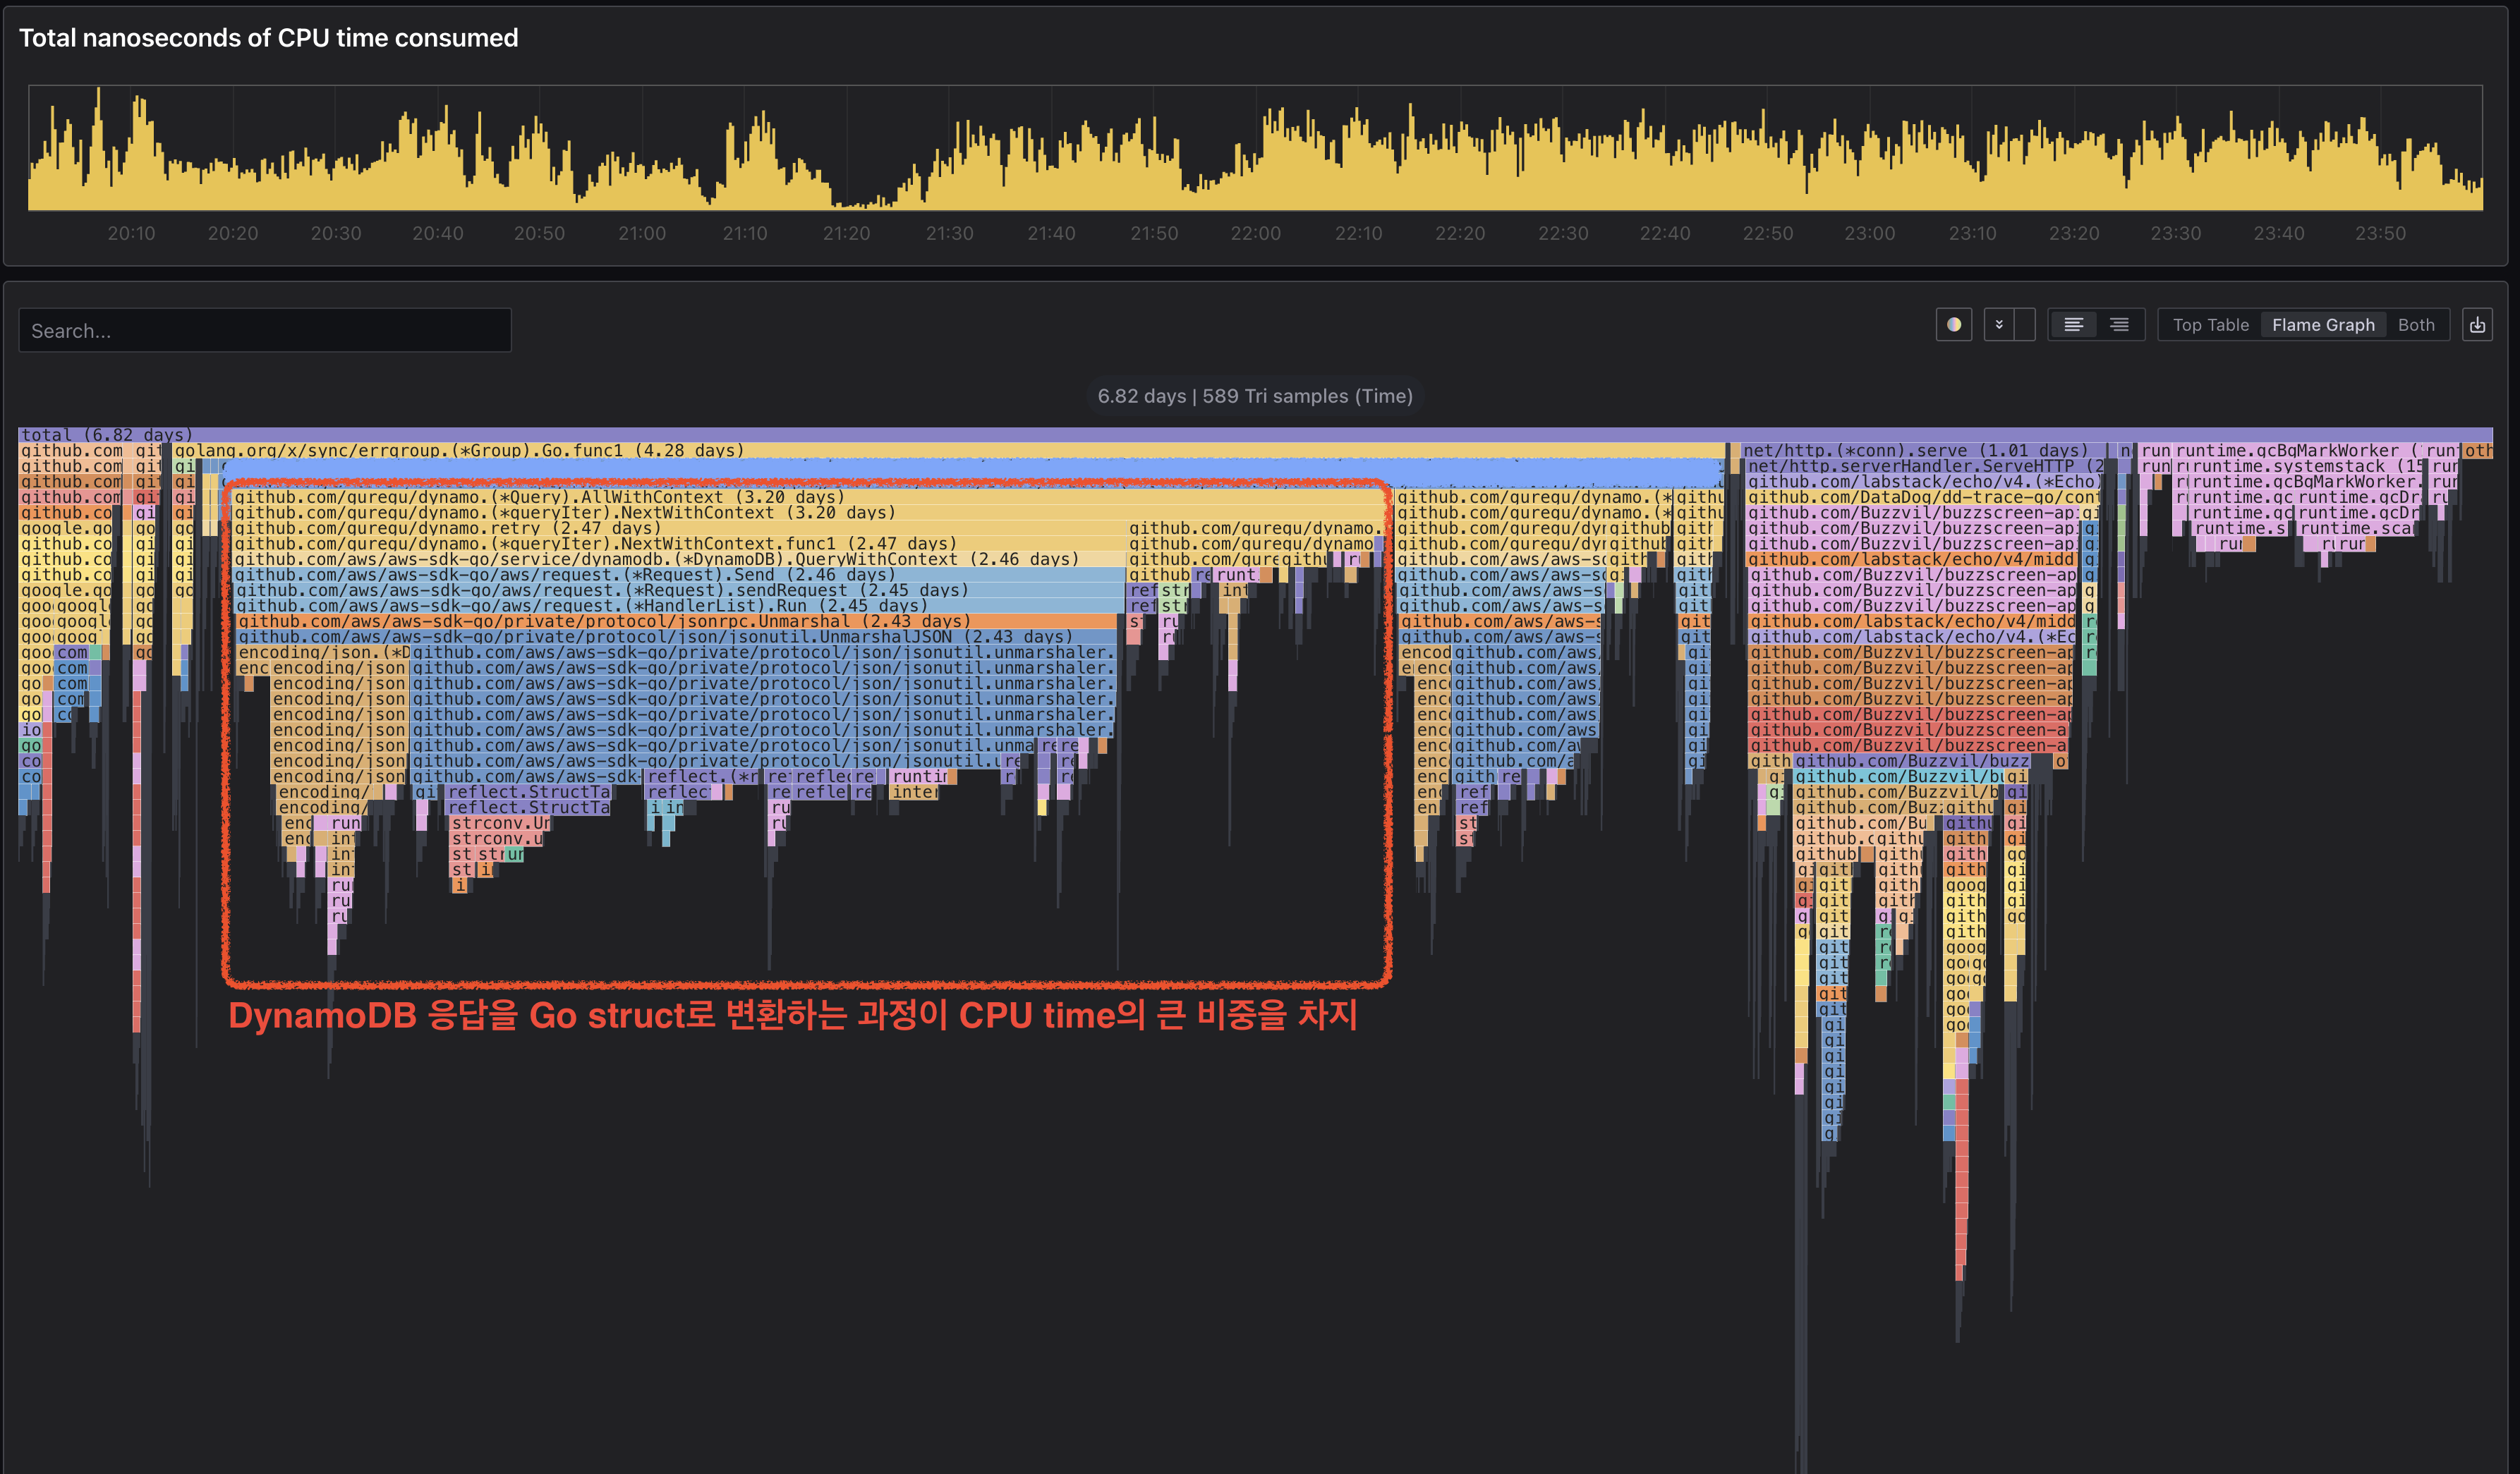 Peak-time flame graph before deployment: paths beneath guregu/dynamo account for nearly half of total CPU.
The flame graph confirmed that converting responses into Go structs consumed substantial CPU after the DynamoDB lookup. We knew JSON unmarshalling could be expensive, but the profile showed it occupying CPU for long enough to give us a concrete direction for improvement.
The cause: AWS SDK v1 beneath the wrapper
The application did not call DynamoDB directly through the AWS SDK. It used the guregu/dynamo wrapper, which makes tables, queries, conditional expressions, and struct marshalling and unmarshalling easier to work with. The underlying AWS SDK handles actual HTTP requests, authentication signing, the DynamoDB protocol, and response parsing.
애플리케이션 코드
    |
    v
guregu/dynamo
    |
    v
AWS SDK for Go
    |
    v
DynamoDB
The broad guregu/dynamo path did not necessarily mean the wrapper itself was the problem. It included the cost of DynamoDB processing in AWS SDK v1 underneath it. The fundamental improvement therefore required changing the SDK processing path. We confirmed that upgrading the wrapper's major version also upgraded its underlying AWS SDK, and decided to move from guregu/dynamo v1 to v2.
| Library | Underlying AWS SDK |
|---|---|
github.com/guregu/dynamo v1 | github.com/aws/aws-sdk-go v1 |
github.com/guregu/dynamo/v2 | github.com/aws/aws-sdk-go-v2 |
On the surface, this was a wrapper version upgrade. Underneath, it changed DynamoDB processing from AWS SDK v1 to v2, giving us reason to expect a significant improvement.
Moving from v1 to v2
The code changes were not complicated. We replaced github.com/guregu/dynamo with github.com/guregu/dynamo/v2.
// before
import "github.com/guregu/dynamo"

err := table.
    Get(hashKey, value).
    AllWithContext(ctx, &items)

// after
import "github.com/guregu/dynamo/v2"

err := table.
    Get(hashKey, value).
    All(ctx, &items)
We also updated initialization to use the v2 DynamoDB client.
ddb := dynamo.NewFromIface(infra.DynamoDBV2())
table := ddb.Table(tableName)
At a glance, it looks little different from removing WithContext from method names, but the unmarshalling mechanism changes substantially. Because both the wrapper's major version and its underlying SDK were changing, we did not roll it out everywhere at once. We used a canary deployment, checked a portion of traffic for errors and abnormal behavior, then expanded gradually.
Scope: a shared bottleneck in ad serving
This was not an optimization of a single API. It improved a user-lookup path shared by multiple ad-serving requests. These requests retrieve user identity, activity history, and targeting data before selecting candidate ads. All that user-related data is stored and read in DynamoDB through a common adapter. When this shared path becomes expensive, CPU costs rise across the ad-serving APIs, not just one request type.
The version upgrade required a relatively small diff, but its impact was far from small. Datadog APM indexed spans showed more than ten million calls to the user-lookup path during one peak hour. Reducing the cost of this frequently called common path produced a visible improvement in CPU metrics for the service as a whole.
Before-and-after measurements
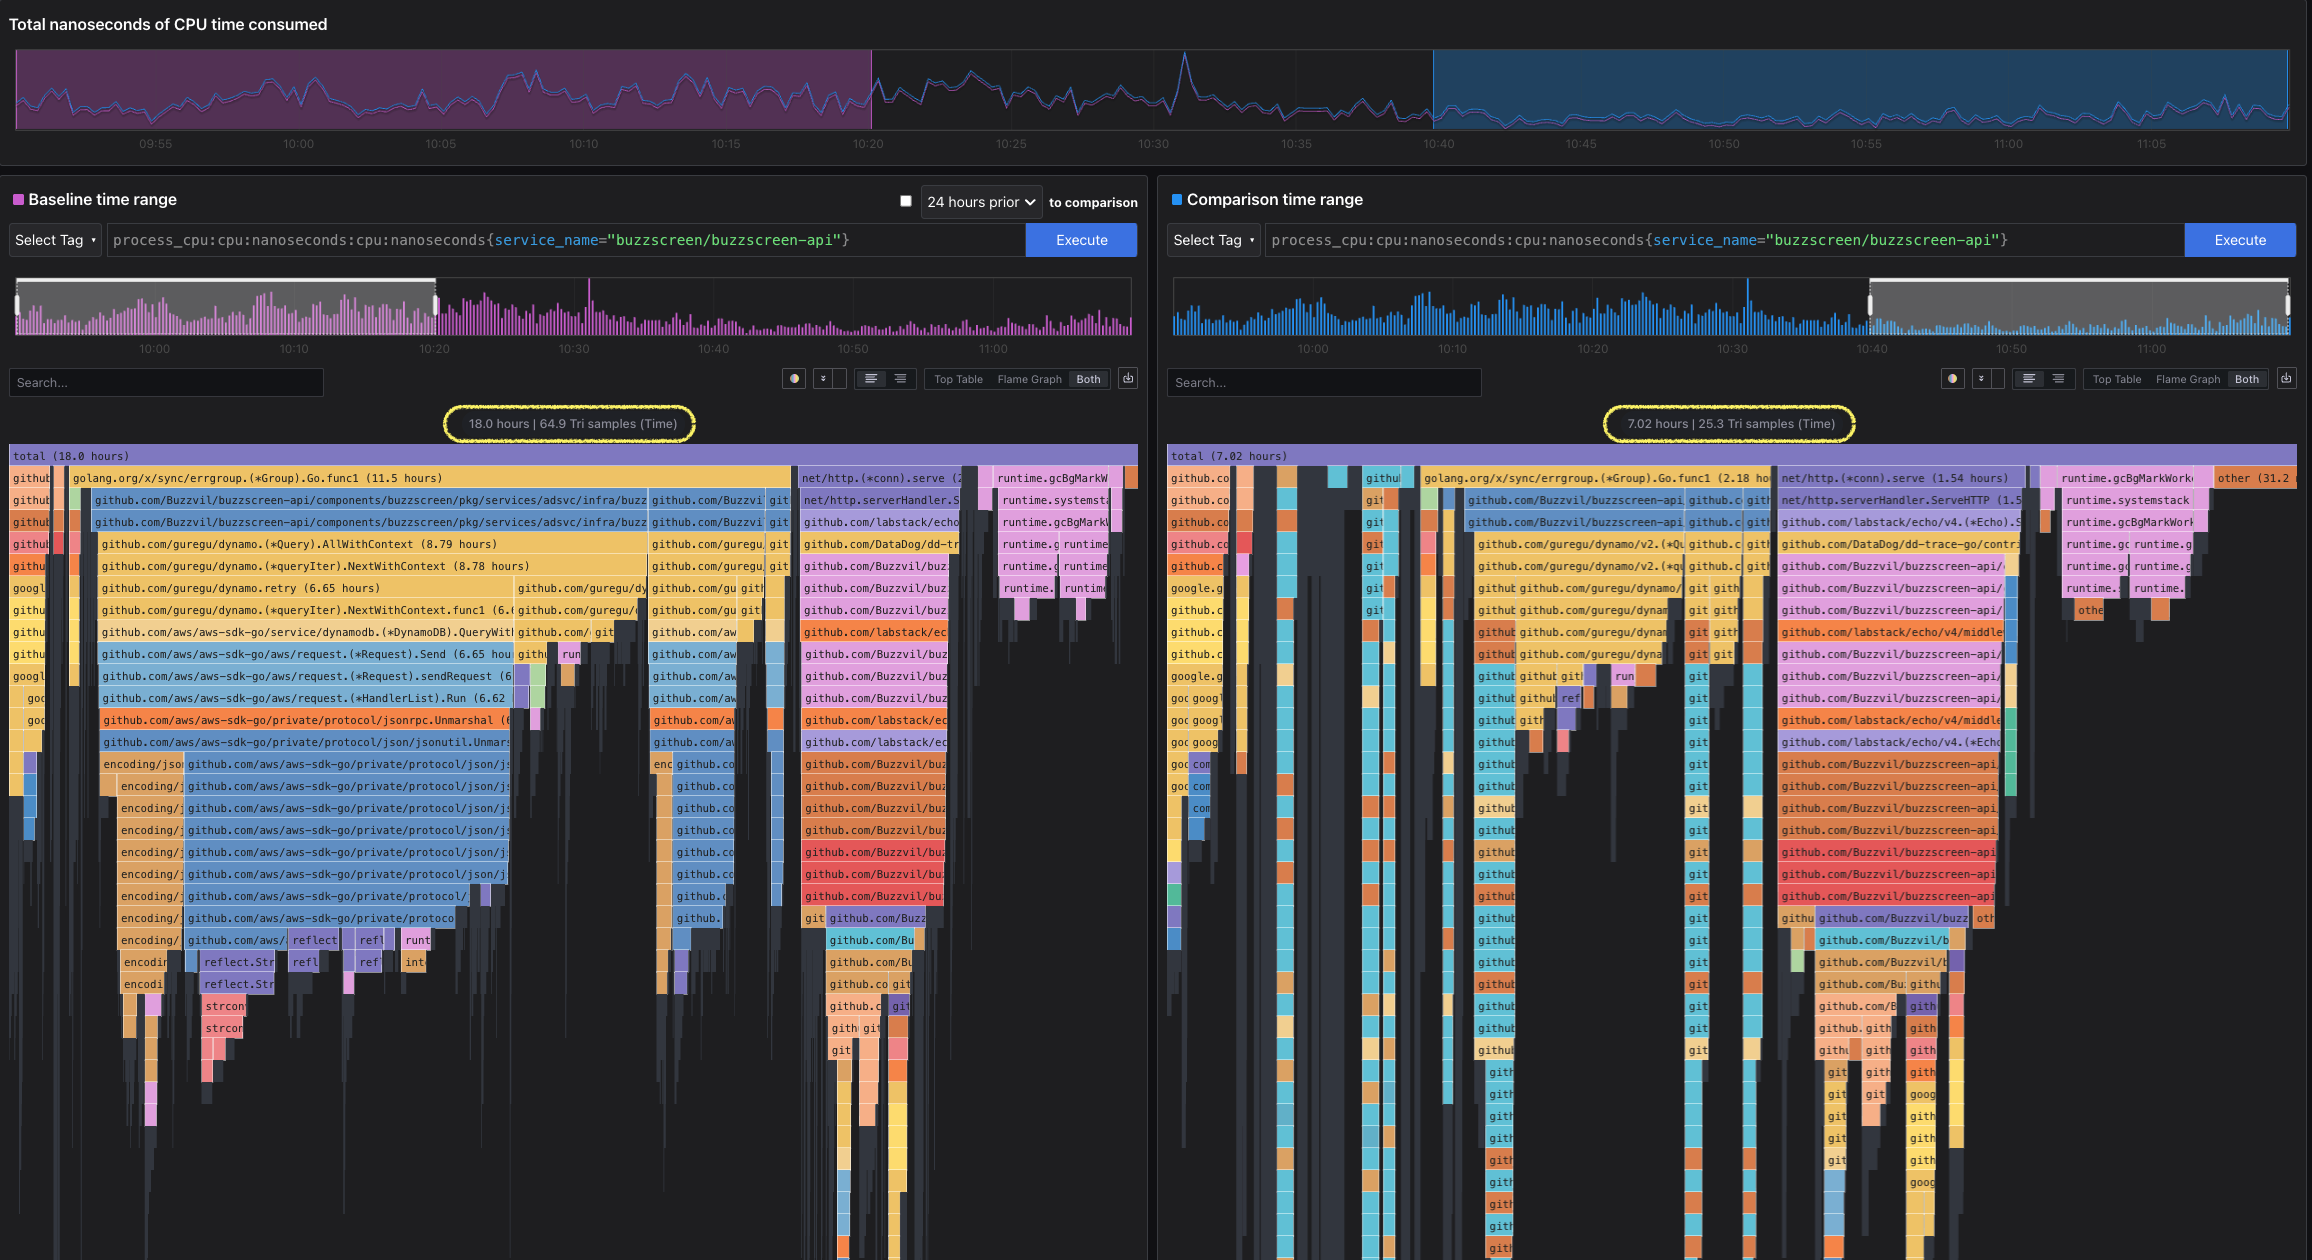 The AWS SDK v1 unmarshalling path disappears from the post-deployment CPU profile.
The Pyroscope comparison above uses 30-minute windows before and after deployment. We excluded the first ten minutes after deployment because old and new pods could coexist immediately afterward.
| Window | Time |
|---|---|
| Deployment | 2026-06-26 10:30 KST |
| Before | 2026-06-26 09:50–10:20 KST |
| After | 2026-06-26 10:40–11:10 KST |
Pyroscope's CPU profile accumulates CPU samples rather than wall-clock time. Because it sums time consumed across multiple pods and CPU cores, a 30-minute window can show a value such as 18h.
| Metric | Before | After | Change |
|---|---|---|---|
| Pyroscope CPU samples | 18h | 7h | -61.0% |
| Requests | 30,057,920 | 28,784,846 | -4.2% |
| CPU per request | 2.149ms | 0.876ms | -59.2% |
Request volume fell slightly, but nowhere near as much as CPU. Even after normalizing per request, the improvement was about 59%, supporting the conclusion that actual processing cost fell.
Where CPU was saved
Total CPU shows the result but not the cause, so we checked which functions declined in Pyroscope's cumulative CPU view.
Cumulative CPU includes both the CPU used by a function itself and by functions it calls. It is useful for measuring the cost of operations grouped in an API handler or repository function.
| Path | Before | After | Change |
|---|---|---|---|
| User activity lookup | 31,865s / 49.32% | 4,929s / 19.54% | -84.5% |
| Targeting model lookup | 8,154s / 12.62% | 1,916s / 7.59% | -76.5% |
| AWS SDK v1 JSON unmarshal | 30,347s / 46.97% | 642s / 2.55% | -97.9% |
reflect.StructTag.Lookup | 8,724s / 13.50% | 840s / 3.33% | -90.4% |
runtime.scanobject | 6,159s / 9.53% | 2,864s / 11.35% | -53.5% |
The most striking change was AWS SDK v1 JSON unmarshalling. Before deployment, nearly half of total CPU was under github.com/aws/aws-sdk-go/private/protocol/jsonrpc.Unmarshal. Afterward, its share fell to 2.55%.
Four days before and after: halving HPA desired pods
The one-hour comparison around deployment shows the immediate effect. But HPA reacts across peak and normal traffic periods, so scaling benefits need a longer observation window. We compared four days before and four days after deployment.
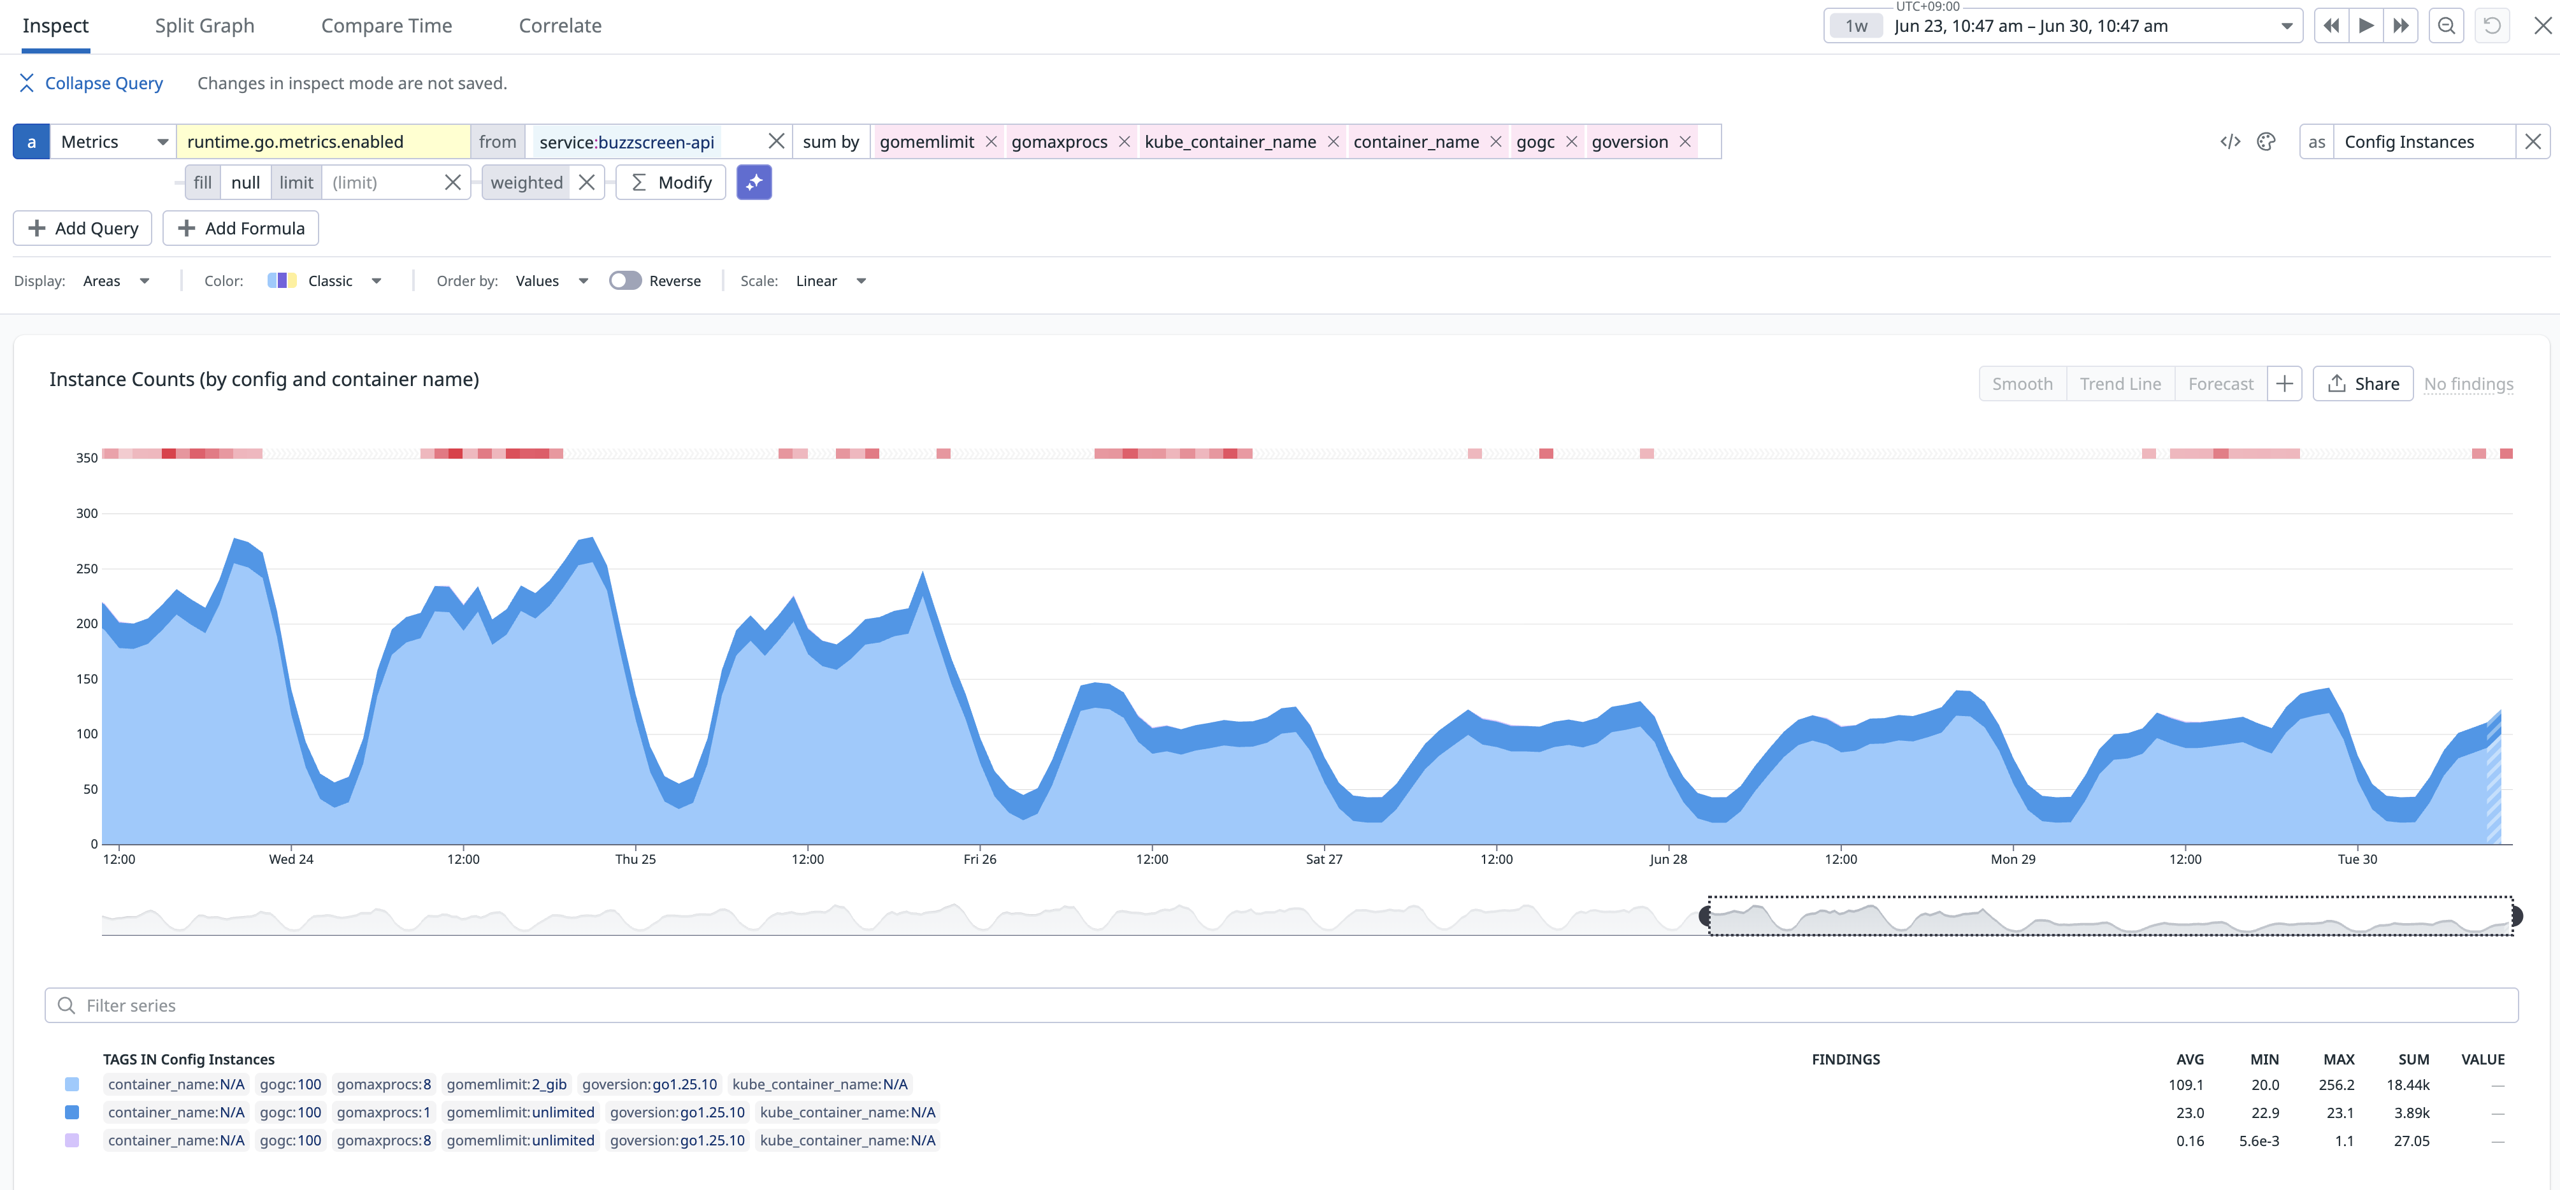 Pod instance counts around the June 26 deployment: the daily peaks became visibly lower afterward.
| Metric | Four days before | Four days after | Change |
|---|---|---|---|
| Datadog average CPU | 690 cores | 369 cores | -46.6% |
| Datadog p95 CPU | 1,418 cores | 788 cores | -44.4% |
| HPA desired p95 | 245 | 109 | -55.3% |
| Requests | 5.06B | 4.58B | -9.5% |
| Error rate | 0.0549% | 0.0510% | Slight improvement |
| Average duration | 2.61s | 2.54s | Slight improvement |
Peak-time HPA desired pods at p95 dropped from 245 to 109. Requests fell only 9.5% over the same period, suggesting a dramatic reduction in processing cost per request rather than simply less traffic.
To rule out day-of-week effects, we also compared Kubernetes metrics for the same weekday and time, using the week before and the day after deployment.
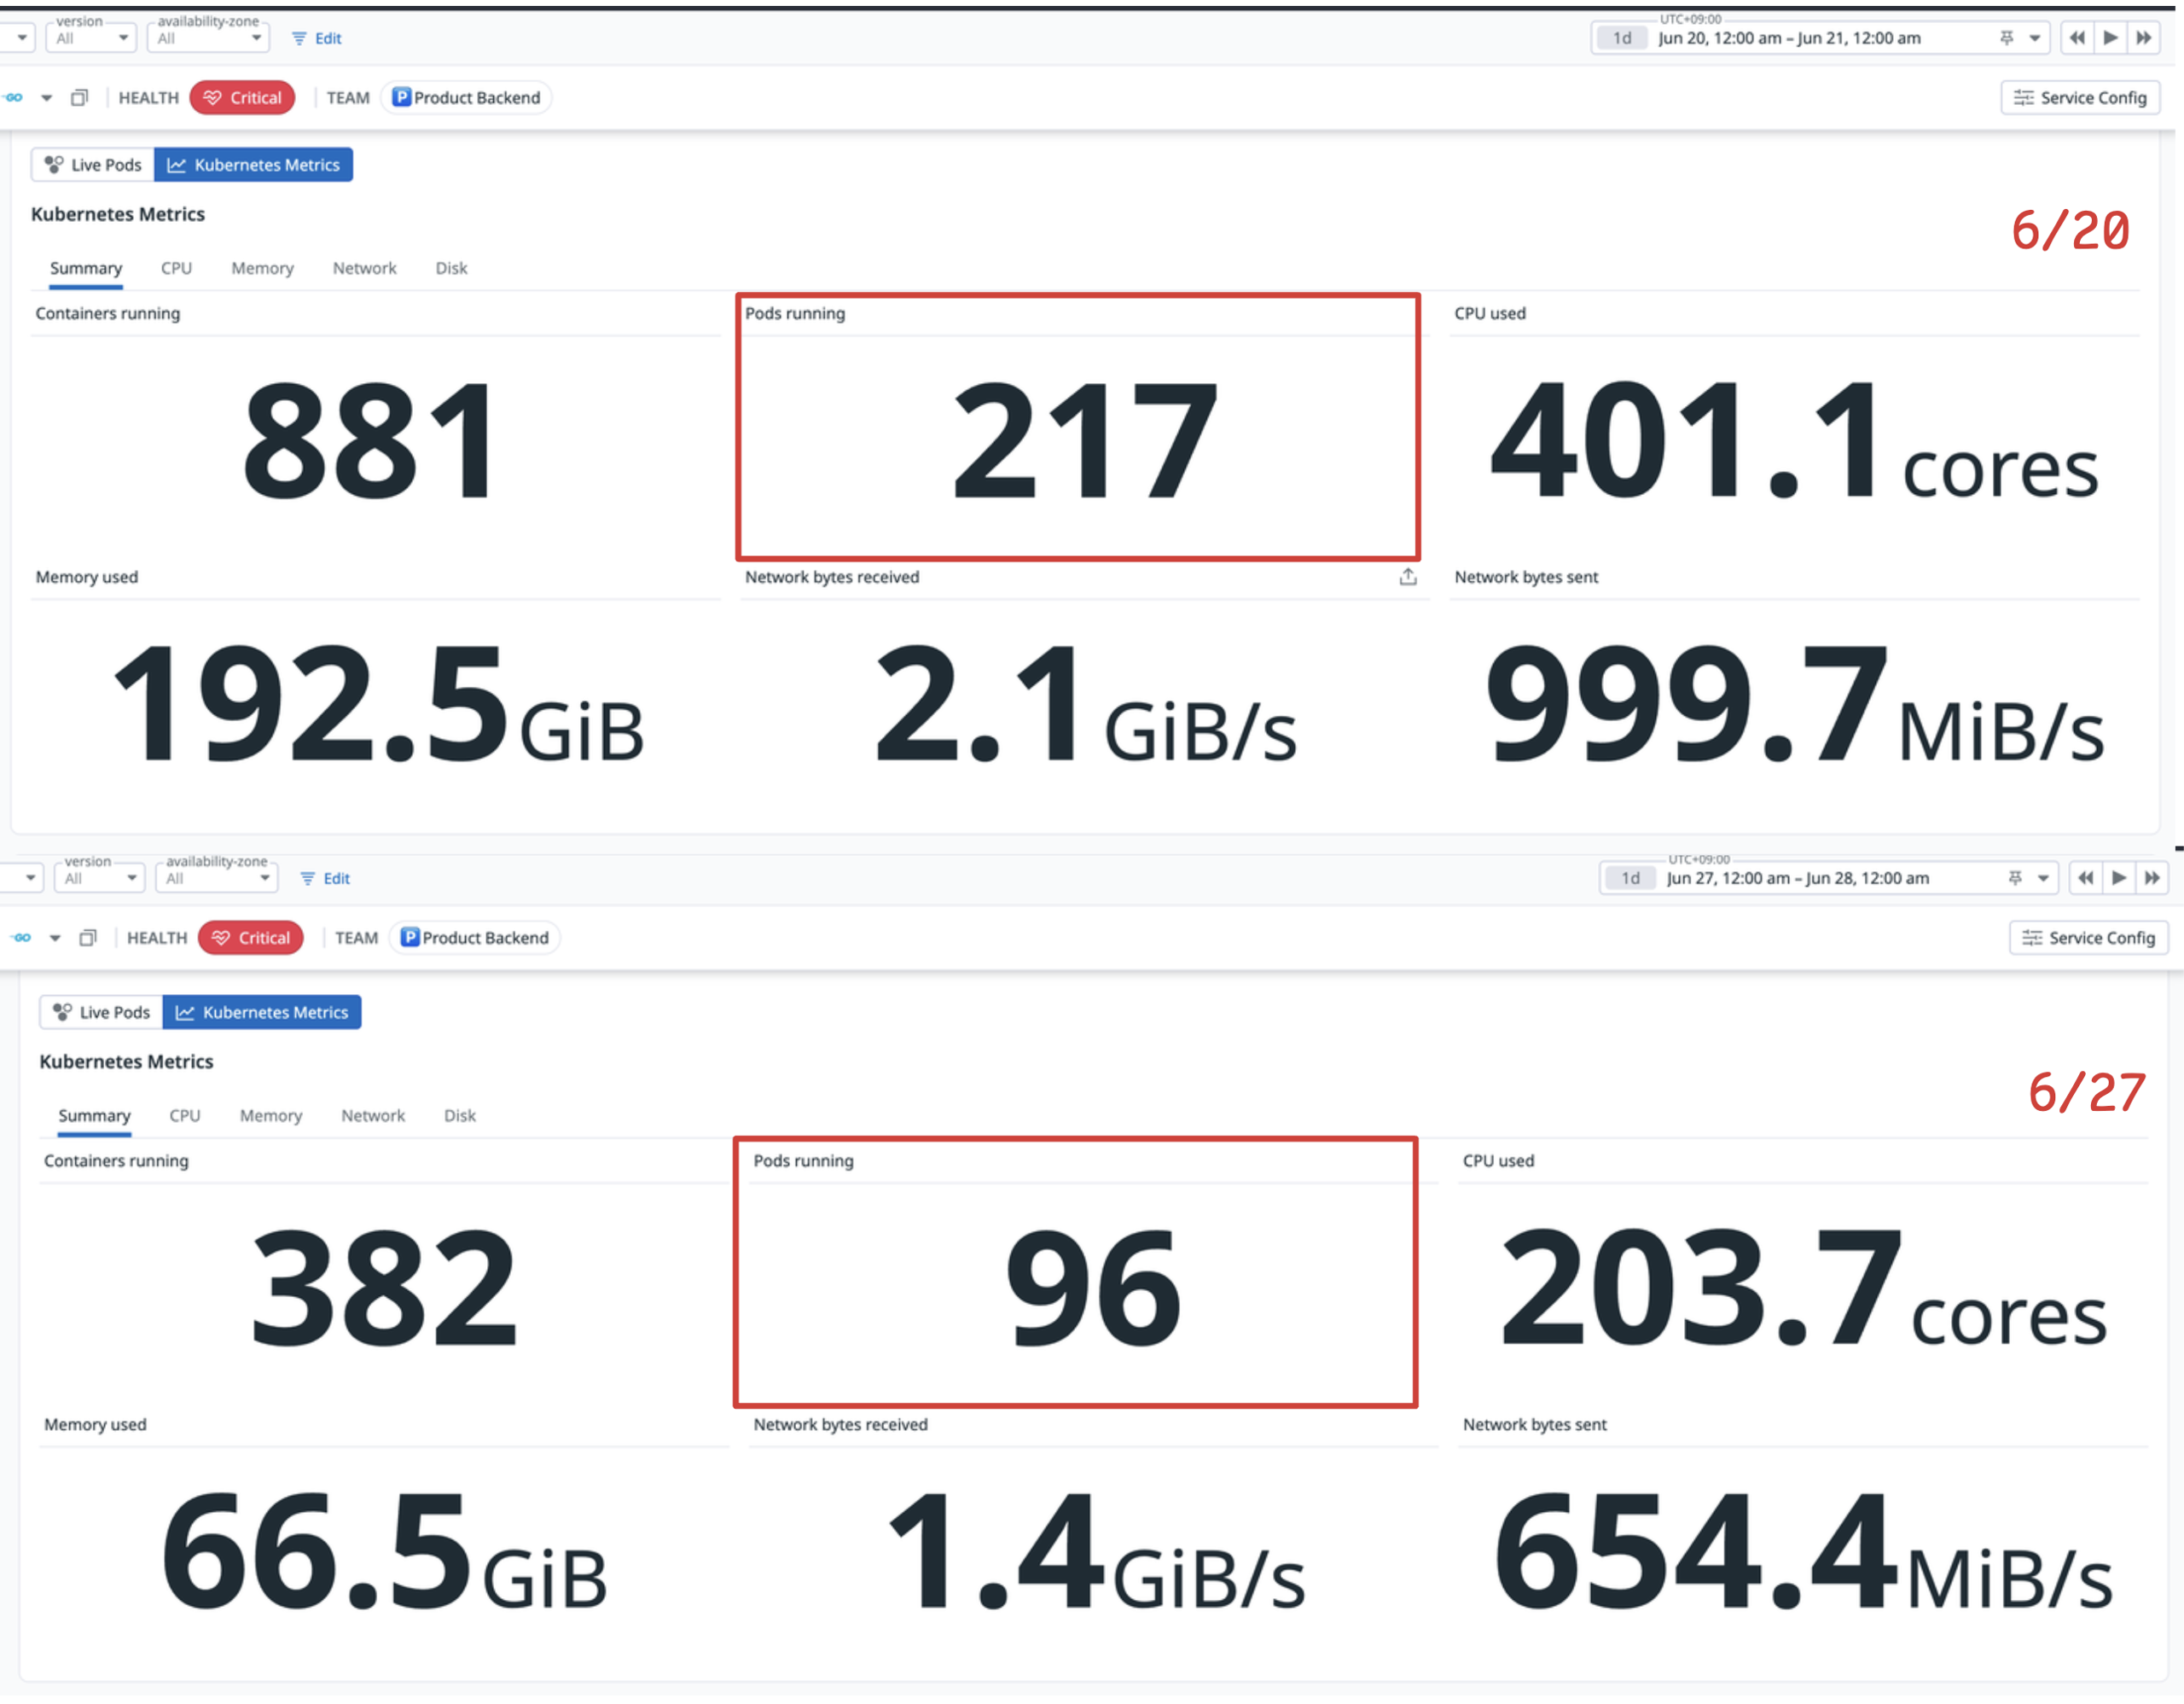 June 20 above and June 27 below, at the same time: running pods 217 → 96; CPU 401.1 cores → 203.7 cores.
Fewer pods translated directly into infrastructure savings. Daily cost for the service's EKS cluster fell from the USD 400 range to around USD 250.
What changed in v2?
The same DynamoDB lookups are still performed. What improved enough to roughly halve CPU use?
v1: reflection-based generic JSON processing
The largest function in the pre-deployment profile was AWS SDK v1's JSON unmarshalling path. The key word is reflection.
Reflection inspects type information at runtime—for example, how many fields a struct has, each field's tags, or whether a value is a pointer or slice. Repeating that for every request, response item, and field is costly.
AWS SDK v1 represents DynamoDB's AttributeValue as one large struct containing pointer fields for multiple types.
type AttributeValue struct {
    B    []byte
    BOOL *bool
    L    []*AttributeValue
    M    map[string]*AttributeValue
    N    *string
    S    *string
    // ...
}
A single DynamoDB value is represented by one such struct. For a string, only S is populated and all other fields are nil; for a number, only N is populated. Each read must therefore check which field is set to discover the actual type. That check repeats for every field of every response item.
The v1 JSON protocol code also scans struct fields and tags using reflection, explaining the large reflect.StructTag.Lookup cost in Pyroscope.
The actual flame graph showed this flow:
사용자 조회 경로
    |
    v
guregu/dynamo v1 Query.AllWithContext
    |
    v
aws-sdk-go v1 jsonrpc.Unmarshal
    |
    v
jsonutil.unmarshalStruct
    |
    v
reflect.StructTag.Lookup
Converting a DynamoDB response to Go structs involved too much runtime reflection.
v2: generated serializers and union types
AWS SDK v2 represents AttributeValue differently. Instead of one large struct holding every possible type, it uses separate structs grouped through an interface—a union-style representation.
type AttributeValue interface {
    isAttributeValue()
}

type AttributeValueMemberS struct {
    Value string
}

type AttributeValueMemberN struct {
    Value string
}

type AttributeValueMemberM struct {
    Value map[string]AttributeValue
}
The value's type is explicit: AttributeValueMemberS for a string, AttributeValueMemberN for a number, and so on. Serializers and deserializers switch on these types.
switch v := av.(type) {
case *types.AttributeValueMemberS:
    // string 처리
case *types.AttributeValueMemberN:
    // number 처리
case *types.AttributeValueMemberM:
    // map 처리
}
This is more specialized for DynamoDB's response structure than generic reflection-based JSON handling. AWS SDK v2 uses serializer/deserializer code generated from the service model. Put simply, it is code that already knows the shape of a DynamoDB response, rather than discovering that shape anew at runtime.
guregu/dynamo/v2 also caches struct type information. In v1, repeated struct-field scans appeared as fieldsInStruct in the profile. In v2, a type cache reuses the field-processing plan.
The changes can be summarized as follows.
| Area | v1 | v2 |
|---|---|---|
| DynamoDB wrapper | guregu/dynamo | guregu/dynamo/v2 |
| AWS SDK | aws-sdk-go v1 | aws-sdk-go-v2 |
| AttributeValue representation | Large struct with many pointer fields | Union of separate type-specific structs |
| Protocol handling | Heavy use of reflection-based generic JSON handling | Generated DynamoDB serializers/deserializers |
| Struct-field processing | Repeated reflection prominent in profiles | Cached type information |
The benefit was not simply that it was a major upgrade or that “SDK v2 is faster.” Moving to v2 reduced reflection-based JSON decoding and struct-tag lookups, and those changes drove the CPU improvement.
Checking with a small benchmark
Production profiles already pointed clearly in that direction, but we also ran a small benchmark with similarly shaped structs to compare marshalling and unmarshalling themselves. It ran locally on a Mac with Go 1.24. Since it did not reproduce production, we used it to check trends rather than absolute values.
| Operation | v1 | v2 | Difference |
|---|---|---|---|
| Marshal | About 2.5–2.7µs / 47 allocs | About 0.8–1.0µs / 17 allocs | About 2.5–3× faster |
| Unmarshal | About 2.3–2.7µs / 23 allocs | About 2.1–2.4µs / 10 allocs | Less than half the allocations |
The benchmark agreed with the production trend. Marshalling improved substantially in both time and allocations. For unmarshalling, the allocation difference was clearer than the timing difference.
Fewer allocations are beneficial in themselves, but in Go they also reduce the work GC must do. Our profile showed absolute CPU for runtime.scanobject dropping from 6,159s to 2,864s.
Closing thoughts
Even after identifying the bottleneck with Pyroscope, I did not expect a single library migration to produce such dramatic resource savings. An AI agent made the upgrade itself straightforward, and seeing the change translate into real metrics was rewarding. Server costs fell from around USD 400 to USD 250 a day, saving USD 3,500–4,500 per month.
Although implementation is becoming easier, recognizing a problem and understanding its cause still require engineering. In an AI era where delivering results is increasingly accessible, this experience made me reconsider which capabilities engineers need most.