AI-translated. Read the original in KoreanEmbedded slides, videos and images remain in their original language.
AWS Cost Optimization, Part 1: How Buzzvil Saved Over KRW 100 Million a Month

Software engineer

During 2023, Buzzvil reduced AWS costs by approximately KRW 120 million per month, equivalent to around KRW 1.4 billion annually. In this series, we share the experience and practical tips.
- AWS Cost Optimization, Part 1: How Buzzvil Saved Over KRW 100 Million a Month
- (Coming soon) AWS Cost Optimization, Part 2: Easy, High-Impact Optimization Tips
- (Coming soon) AWS Cost Optimization, Part 3: The Secrets of Data Transfer Costs
Overview
In December 2022, Buzzvil's AWS bill was around KRW 360 million. After a year of sustained effort, by December 2023 we had reduced it to KRW 240 million a month—two-thirds of the previous year's level. This post explains the approach that made the optimization successful.
Why we began optimizing AWS costs
Since launching its first service in 2013, Buzzvil's rewarded advertising platform has grown rapidly, reaching nearly KRW 60 billion in annual revenue. Product development speed and cost optimization involve tradeoffs. We often chose faster development even when it cost more, and AWS expenses kept rising.
Buzzvil had built a solid revenue base, but with a prolonged economic downturn and a frozen startup investment market, we wanted a stronger foundation for endurance. Optimizing AWS, a major expense, became necessary.
Setting a goal
Because cost and development speed trade off against each other, we needed a sensible balance rather than an extreme. That required an objective standard for how far to optimize. The finance team provided a clear one: infrastructure cost as a proportion of revenue.
Although it varied month to month, that ratio had nearly doubled from 2021 to 2022. Our goal was to bring it back to its previous level or lower. Our AWS account manager also suggested that typical SaaS companies spend 4–8% of revenue on infrastructure. We aimed to avoid a risky cost level and operate more efficiently than a typical SaaS company.
Choosing metrics and building a scoreboard
Before starting, I considered how to motivate the work. Around that time, the company gave me The 4 Disciplines of Execution to help develop my leadership.

The book presents four disciplines:
- Focus on the wildly important.
- Act on lead measures.
- Keep a compelling scoreboard.
- Create a cadence of accountability.
The third stayed with me most. A scoreboard that makes it easy to see whether you are winning or losing increases motivation and helps you reach the goal. Imagine friends playing basketball without keeping score: once someone brings out a scoreboard and starts counting, everyone tries harder to win. I recognized that experience, so I decided to build a scoreboard.
Then came the question of what to score. Initially, I considered the actual AWS bill—the ultimate output we wanted to improve. But that had a problem: even successful optimization could be obscured by rising traffic or other cost increases. We needed an input metric that reflected our work directly while materially influencing the final goal.
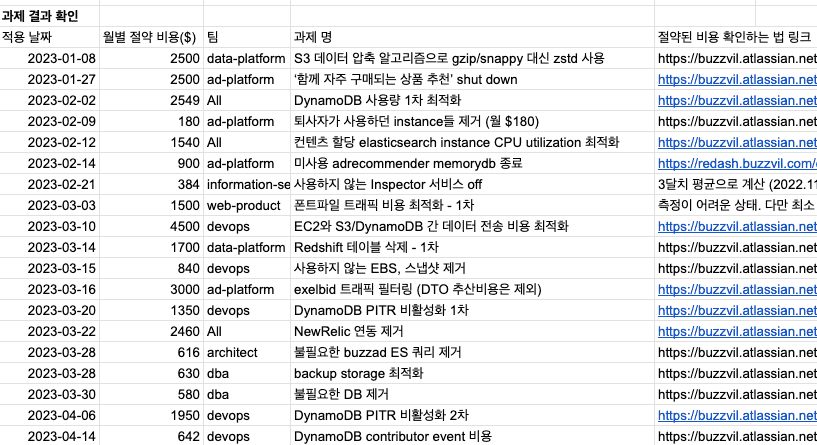
For each completed task, we measured the service's cost before and after, then converted the savings to a monthly equivalent. On the scoreboard, a red line showed cumulative savings, with a target of completing USD 100,000 worth of monthly-saving work by December.
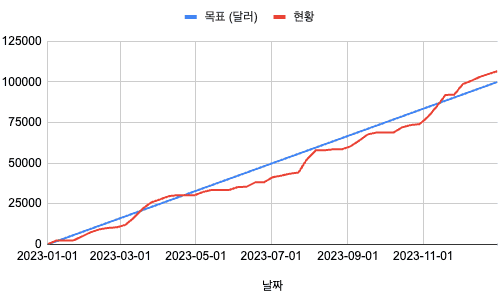
It was now easy to see whether we were losing—the red line below the blue—or winning. The graph shows a substantial increase in optimization work after November. The scoreboard motivated our year-end sprint.
We completed roughly 100 tasks over the year, exceeding the USD 100,000 target with USD 106,000 in calculated monthly savings. The actual bill fell by USD 88,000, about 80% of the work's estimated effect. That demonstrated the gap between input and output metrics and reinforced that choosing an input metric had been appropriate.
For reference, we entered these figures manually in a spreadsheet whenever a task was completed. As an engineer, I felt a strong urge to automate it, but manual management was sufficiently efficient.
Drilling down
With the scoreboard ready, it was time to do the work. To decide which tasks to tackle, we needed to break down spending at different levels.
Buzzvil uses AWS through the MSP Megazone. Unfortunately, that arrangement did not give us access to AWS Cost Explorer. However, the Cost Pivot feature in Megazone's HyperBilling dashboard was sufficient to analyze costs across different dimensions.
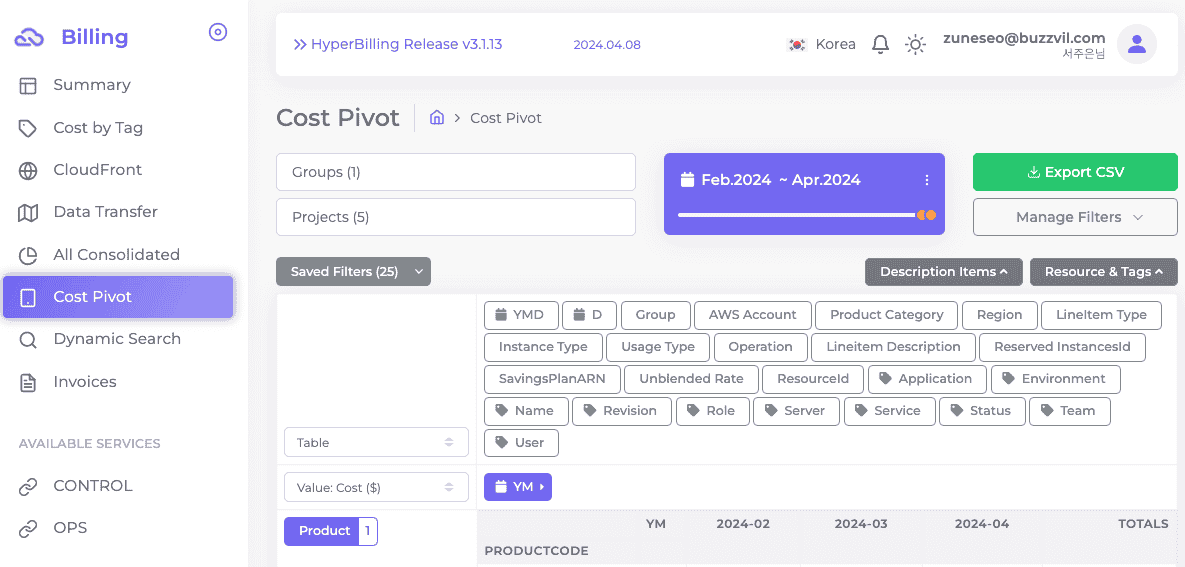
The first numbers to inspect are costs by service. They provide an initial view of where optimization could have the greatest effect. Here are the actual changes for Buzzvil's major services.
| Service | December 2022 | December 2023 | Change |
|---|---|---|---|
| AmazonEC2 | $75,104 | $58,959 | -21.50% |
| AWSDataTransfer | $71,908 | $35,869 | -50.12% |
| AmazonDynamoDB | $41,093 | $19,750 | -51.94% |
| AmazonS3 | $25,253 | $20,595 | -18.45% |
| AmazonRDS | $25,122 | $11,862 | -52.78% |
| AmazonAthena | $7,501 | $9,408 | 25.42% |
| AWSELB | $6,862 | $3,606 | -47.45% |
| AmazonCloudWatch | $5,499 | $4,278 | -22.20% |
| AmazonCloudFront | $3,485 | $5,997 | 72.08% |
EC2 and data transfer were the two largest expenses. You may already be thinking that data transfer approaching EC2 cost sounds excessive. There was indeed substantial room to optimize it, and by December 2023 it had fallen by around 50%. DynamoDB and RDS MySQL, our main databases, were also major expenses; we reduced those by roughly 50% too.
To investigate each service more deeply, use Cost Pivot's dimensions. The most useful dimension depends on the AWS service and your company's usage patterns, so try several approaches.
If I had to pick one generally useful dimension, it would be Lineitem Description. It splits costs at a useful level of detail and describes in plain text what the charge is for. For DynamoDB, for example, it provides the following breakdown.
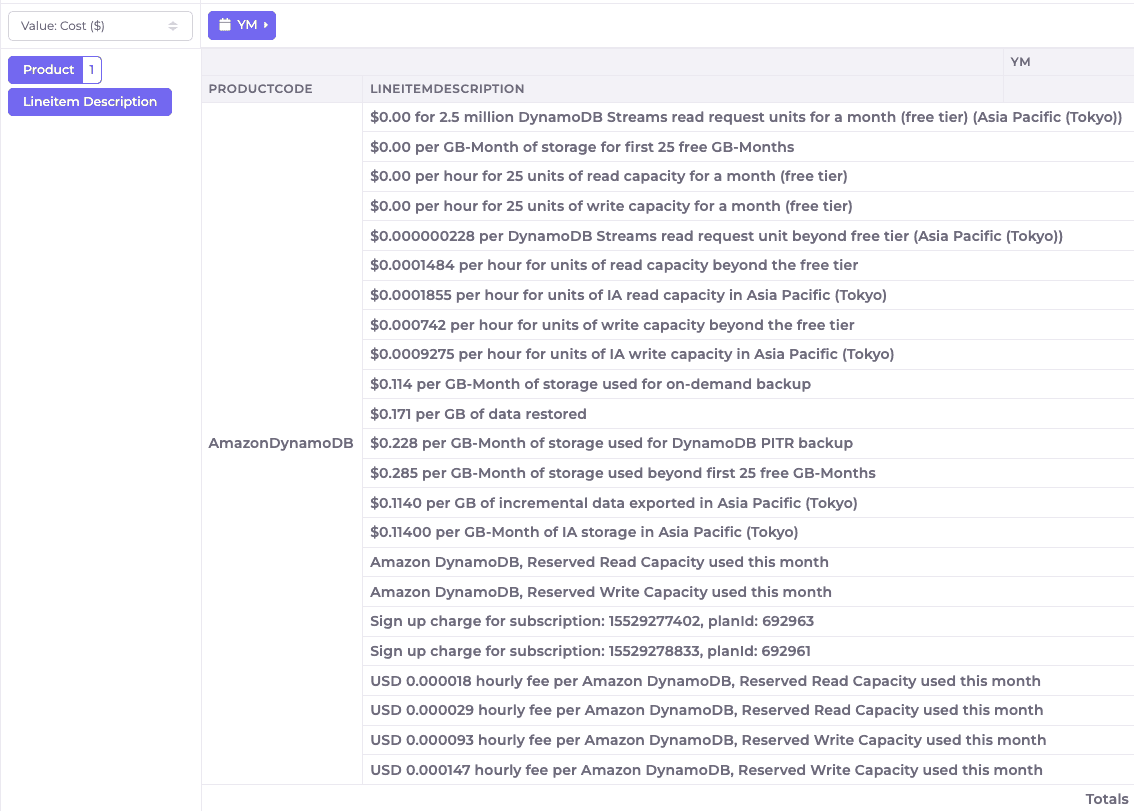
Other dimensions we frequently used were:
AmazonEC2
- Name: Costs by the name assigned when creating an instance.
- Operation: Separate instance, storage, NAT Gateway, and other costs.
AWSDataTransfer
- Product Category: For multi-region services, separate cross-region communication costs.
- Operation: Separate load balancer, S3, cross-AZ, and other transfer charges.
- Resource ID: Identify the ELB instance, EC2 instance, S3 bucket, or other resource generating transfer costs.
AmazonDynamoDB
- Resource ID: Costs by table.
- Usage Type: Separate read, write, and storage costs.
AmazonS3
- Resource ID: Costs by bucket.
- Operation: Charges by S3 API call or storage class.
AmazonRDS
- Resource ID: Costs by instance.
- Usage Type: Separate instance and storage costs.
Developing an intuition for the numbers
As you drill into the data, you sometimes think, “That looks strange.” You also need to estimate the likely benefit of optimizing it. Understanding each service's pricing structure and remembering key figures helps. Relative cost differences proved especially useful. Here are a few examples.
Data transfer costs more than you might think
Buzzvil mainly uses Athena to query data stored in S3. Athena charges by the amount scanned: scanning 1 TB costs USD 5. We encourage everyone to analyze data themselves, so many colleagues write Athena queries. They need to understand what their queries cost, and “1 TB = USD 5” has become a number everyone remembers.
Most of Buzzvil's infrastructure is in Tokyo, but our analytics infrastructure is in Oregon, for reasons that were unavoidable at the time. We therefore copy data from Tokyo to Oregon and analyze it with Athena.
How much does transferring 1 TB from Tokyo to Oregon cost?
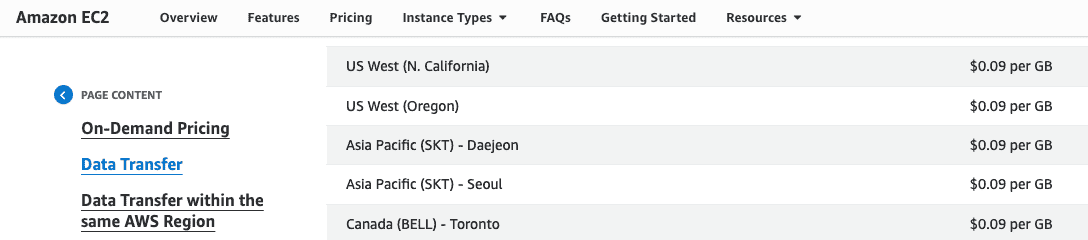
The official website states “$0.9 per GB.” Expressed per TB, the figure used here is:
1 TB = $90
That is 18 times the Athena scanning cost. It made us realize how expensive the decision to move data to another region for processing had been. I had seen “$0.9 per GB” many times before, but had not really understood its practical meaning. Comparing it on the same basis as Athena made it tangible. That is what I mean by an intuition for numbers.
We converted other AWS prices to a per-TB basis too, using Tokyo-region rates.
- Transfer out of AWS: $114
- ALB data processing: $8
- NAT Gateways data processing: $62
- S3 Standard storage: $25
- RDS MySQL storage: $138
- DynamoDB storage: $285
This makes it clear, for example, that NAT Gateway processing is expensive, and that backing up RDS MySQL data in S3 can store it for less than one-fifth the price.
DynamoDB writes cost five times as much as reads
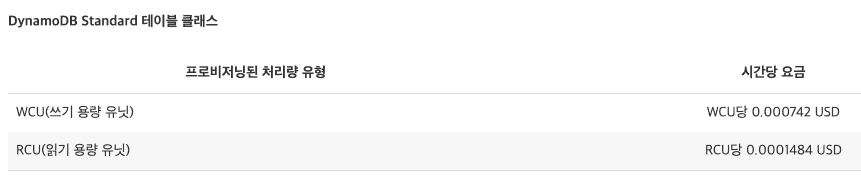
The many decimal places in the official pricing tables make them hard to read, but writes cost exactly five times as much as reads. That matters when optimizing. Adding an index, for example, can reduce read cost while increasing write cost; the price difference should inform the decision.
Commitments can provide discounts of 25%, 50%, or 75%
The figures vary slightly by service, but commitment discounts fall broadly into two groups.
- About 25% for one year and 50% for three years: EC2, RDS, ElastiCache.
- About 50% for one year and 75% for three years: DynamoDB, Redshift.
For DynamoDB and Redshift, where a three-year commitment can yield a 75% discount, a more proactive commitment strategy may be appropriate.
Closing thoughts
This post covered the beginning of our AWS cost optimization effort: building a scoreboard and drilling into cost data to identify tasks. In the next posts, we will share more concrete examples by service. Stay tuned :)