AI-translated. Read the original in KoreanEmbedded slides, videos and images remain in their original language.
Improving Geographic Targeting: A Backend Developer’s Story from Ad Management

Software Engineer
Hello, I'm Kay, a backend developer in the Ad Management unit of the Demand Product team.
It's already been almost two years since I joined. I'd like to introduce what Ad Management (AdM) does and share a project I particularly enjoyed.
Sprints and Agile Working
AdM works in two-week sprints. I've heard that, once upon a time, Buzzvil was organized into functional teams. Today, we work in mission-based teams. AdM consists of a PM, a designer, a QA manager, two backend developers, and one frontend developer. Two weeks can feel either long or short; what matters is accurately judging what you can accomplish within that period. Defining a manageable scope for yourself within a sprint feels, to me, like the heart of agile working.
Open Communication
Buzzvil has a truly open communication culture. It doesn't matter whether you're a new hire or a senior colleague: you can share your views on your work, and those views are respected. Of course, if there are gaps in an idea or room for improvement, others can offer their perspective too. At Buzzvil, you need both the willingness to speak up in pursuit of a better result and the openness to take feedback on board.
Contributing from Day One!
I still remember it vividly. I joined on a Monday, worked through the whirlwind of paperwork and onboarding, and attended my first team scrum on Tuesday. There was a very straightforward task waiting to be done, and our engineering manager looked at me with a twinkle in their eye: “Kay, I think you could take this one on. What do you think?” Looking back, it was an ideal onboarding task, but I remember being a little taken aback at the time. Isn't there something fun about a startup where you dive into real work the day after joining?
Now I'd like to talk about a project I took on just one month after joining.
I'll explain the problem, how we solved it, and how we communicated as a team along the way.
Discovering the Problem
Buzzvil ads support a variety of targeting options. We can target users in a particular age range or deliver ads only within selected apps. One of those options is geographic targeting, which lets advertisers serve ads in specific locations. One day, someone reported a defect in this feature.

First, I investigated how geographic targeting was being used.
South Korea has approximately 250 city-, county-, and district-level administrative areas: around 70 cities, 80 counties, and 100 districts. We discovered that registering dozens of counties and districts for geographic targeting could exceed the packet size limit of Elasticsearch 5 (ES5), which we were using at the time.
Our targeting data consisted of highly detailed sets of coordinates. Selecting many areas made the data exceed the default limit of one megabyte. For example, Yangcheon-gu in Seoul looks like the map below on the left. Its coordinate representation appears on the right. Yangcheon-gu alone consists of 197 points.
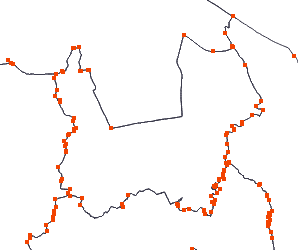
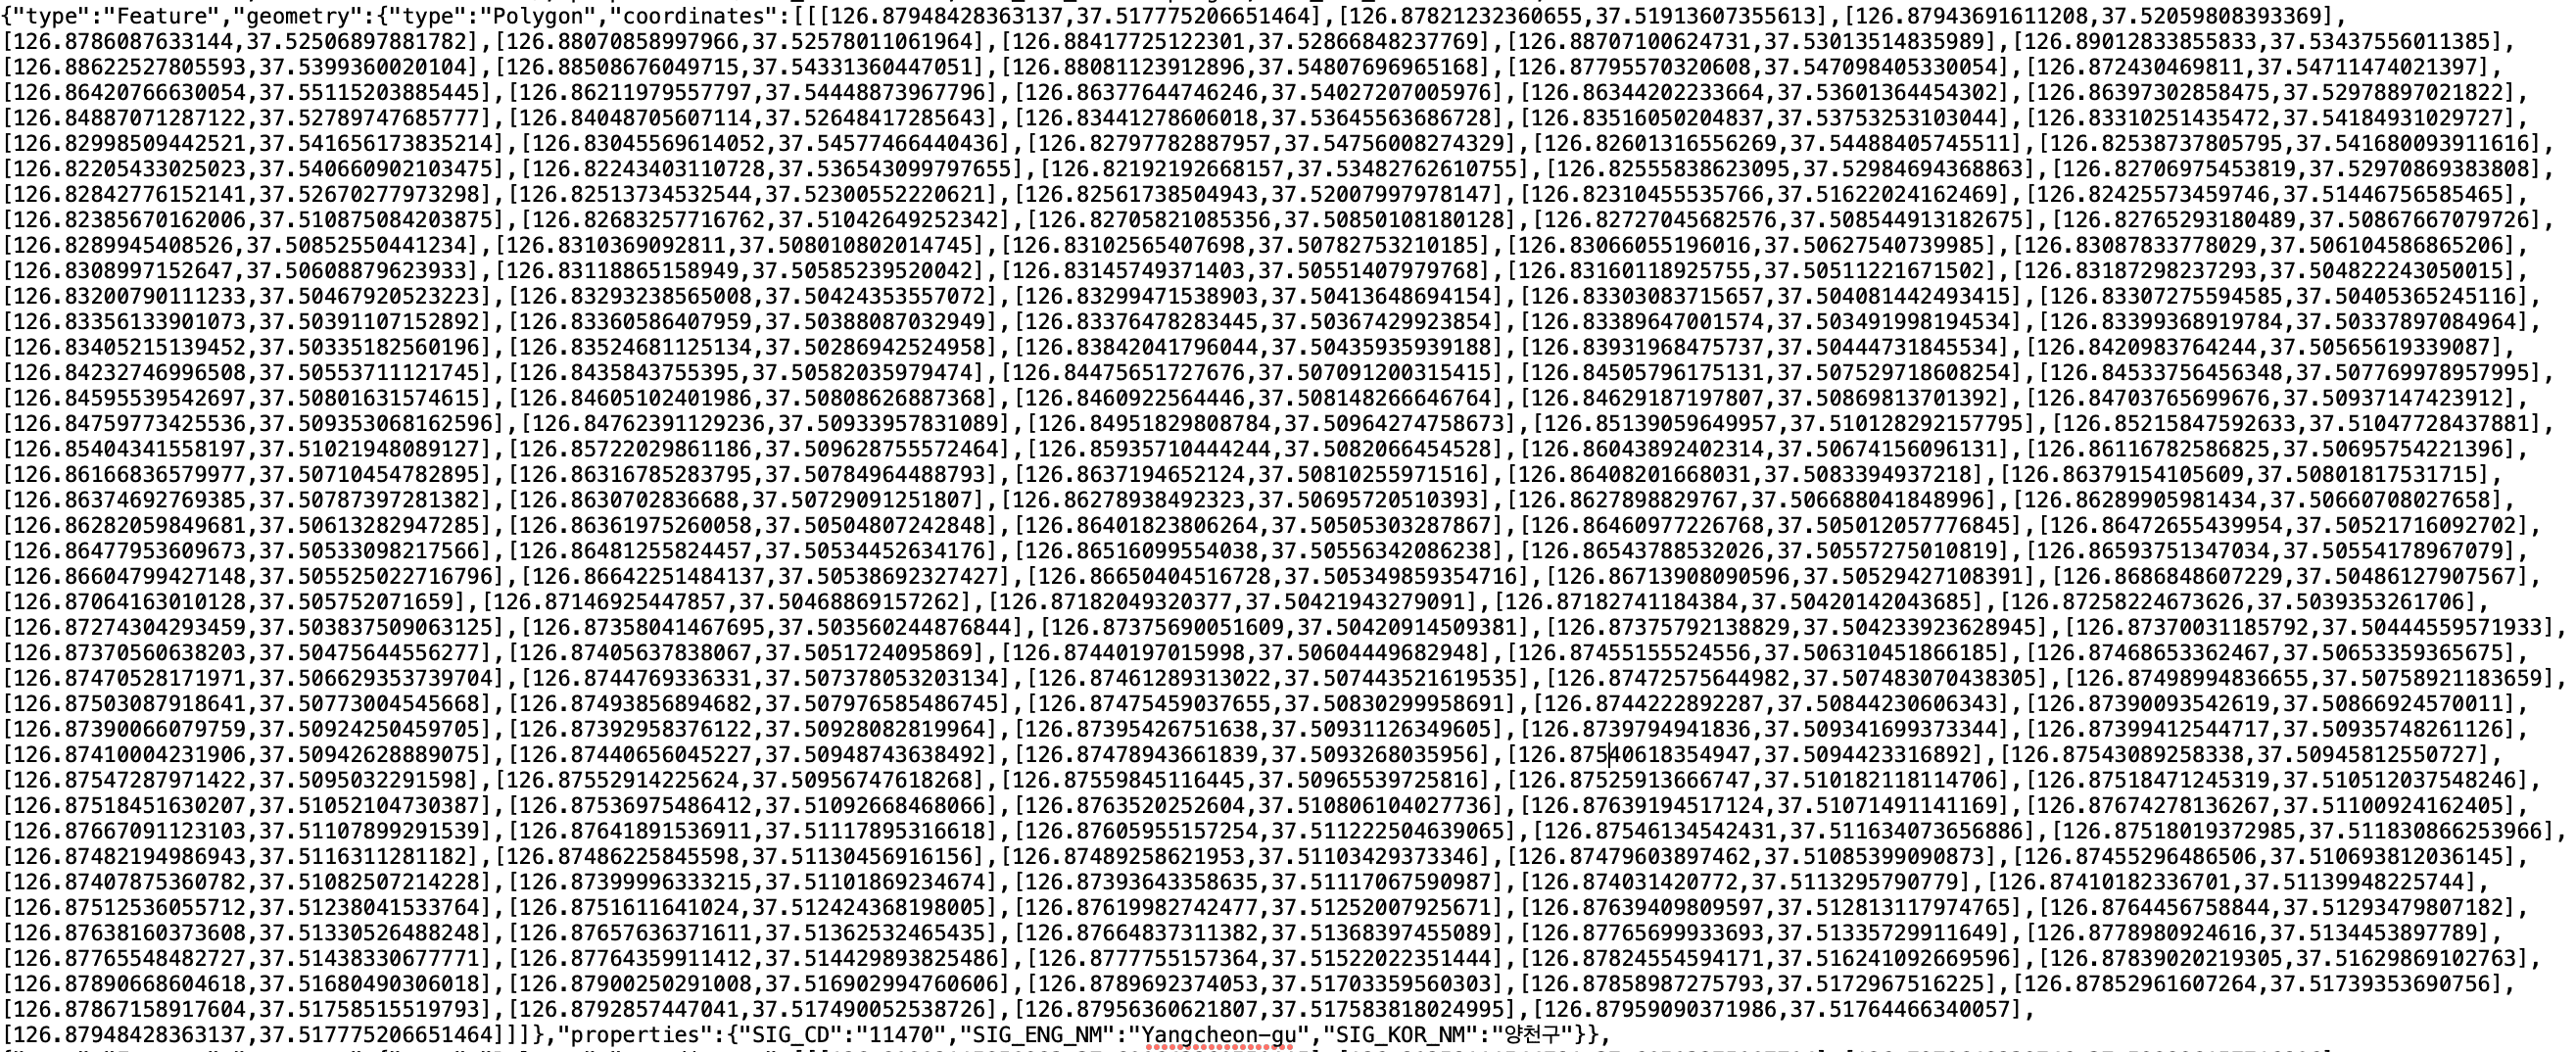
Each coordinate took slightly less than 40 bytes. Even a rough calculation put Yangcheon-gu at about 8,000 bytes. Many areas required more data than Yangcheon-gu, so we concluded that 1 MB wasn't enough to select all 250 areas.
Finding a Solution
The simplest fix would have been to raise ES5's packet size limit. But delivering ads quickly is one of the most important requirements of an advertising system. The data wasn't enormous, so the impact might have been small, but we felt that increasing the amount of geographic data sent over the network could still hurt performance. We also planned to retire ES5 and migrate to ES8. I wanted a fundamental solution that didn't depend on configuration or other external factors. Ultimately, the key was to reduce the amount of stored data. After carefully considering several approaches, we found a way to dramatically reduce its size—with a trade-off.
Convex Hulls
A convex hull is an enclosing convex polygon. We can find one that contains every point in a set using an algorithm called Graham scan. Applying a convex hull to Yangcheon-gu, for example, reduces its 197 points to around 20—a substantial reduction in data size.
Explaining the entire algorithm in words can get complicated, so I'll use illustrations to make Graham scan as straightforward as possible.
Before we get to the visuals, here's the basic idea: to establish that points lie on the outer boundary, every consecutive group of three points must make a “left turn.” It's easier to understand by watching the algorithm work than by discussing the mathematics. Let's take a look.
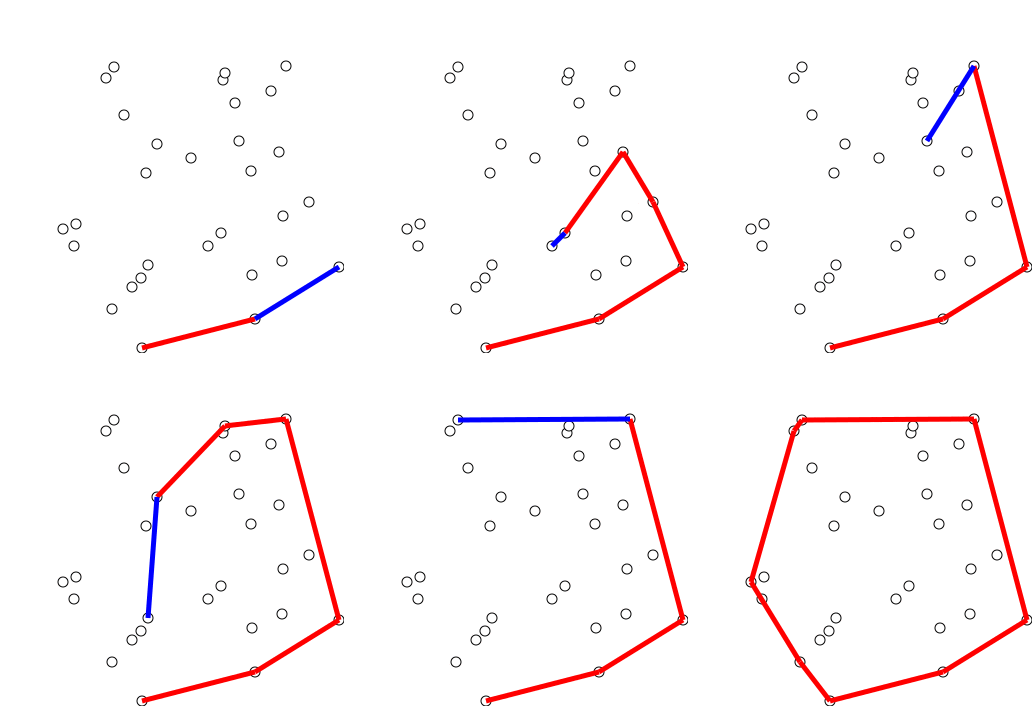
Source: Wikipedia, Graham scan
The animation gives an overview of the process. Now let's go step by step through how those lines are chosen.
First, choose a reference point and number all the other points counterclockwise around it. Typically, the reference point is the lowest point on the y-axis. We also need a stack. Start by pushing the reference point onto it.
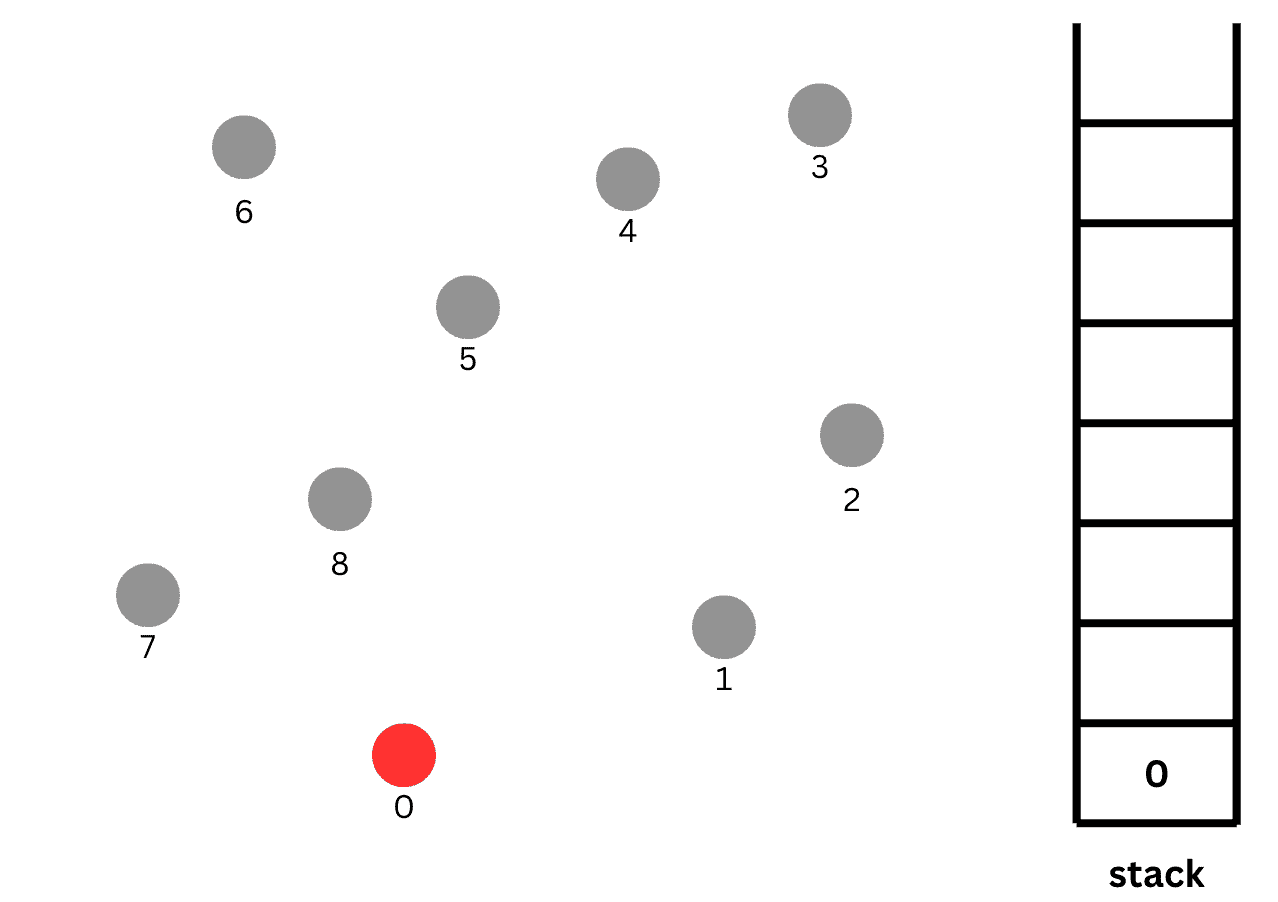
Next, push point 1 onto the stack and draw a line from 0 to 1.
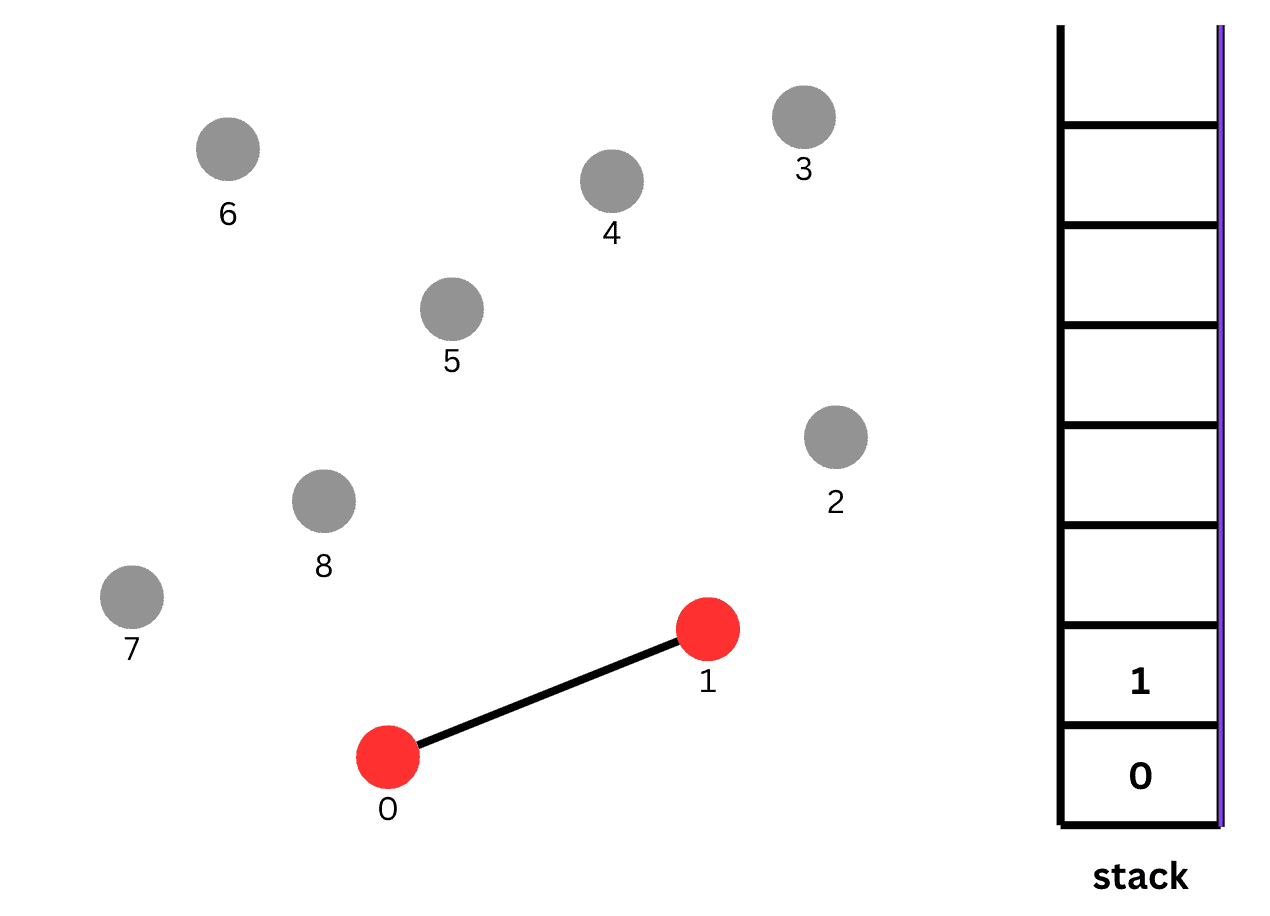
Now it's time to examine point 2.
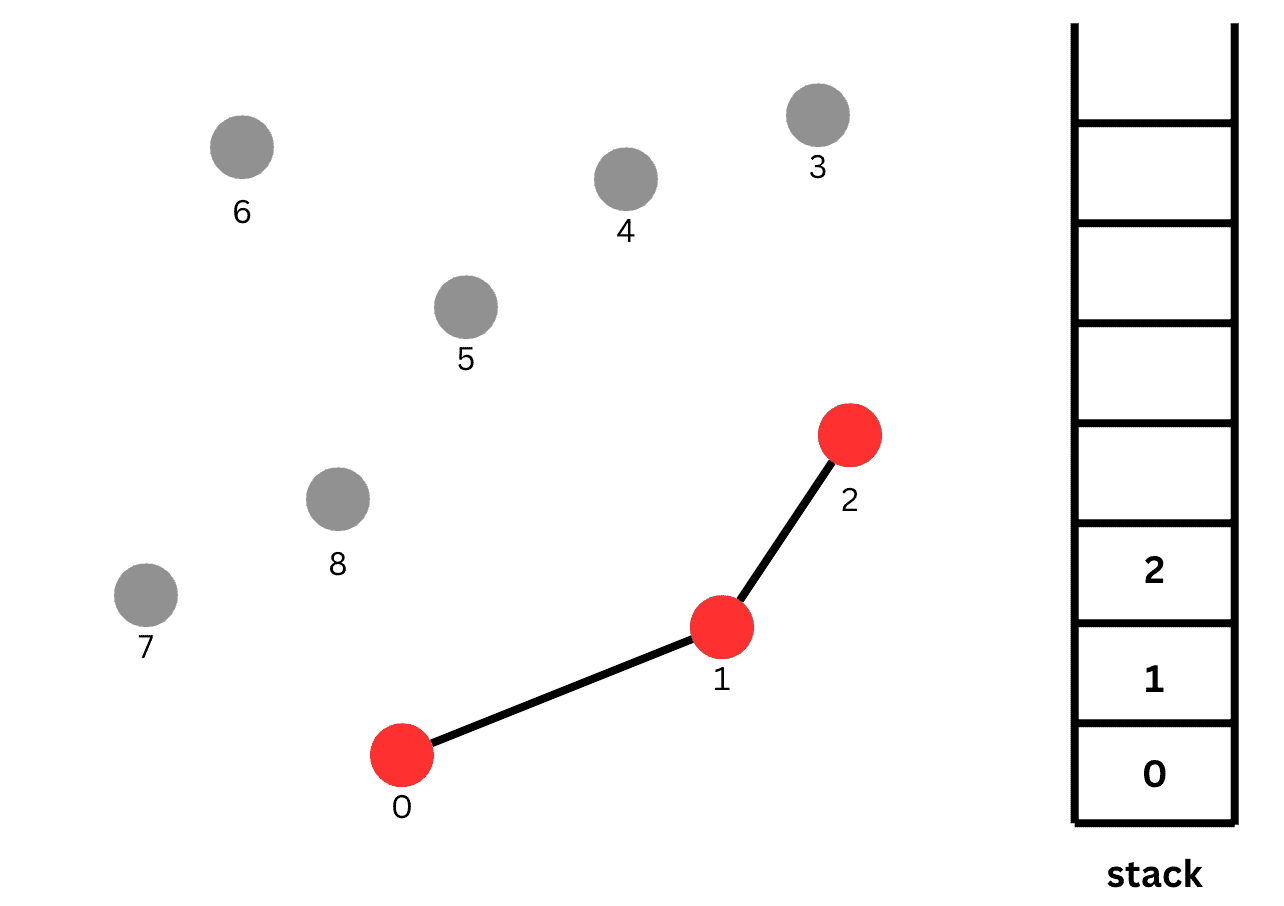
Call the line from 0 to 1 A, and the line from 1 to 2 B. If moving from A to B makes a “left turn,” these points can form part of the convex hull. Points 0, 1, and 2 meet that condition. Push 2 onto the stack, then compare 1→2 with 2→3.
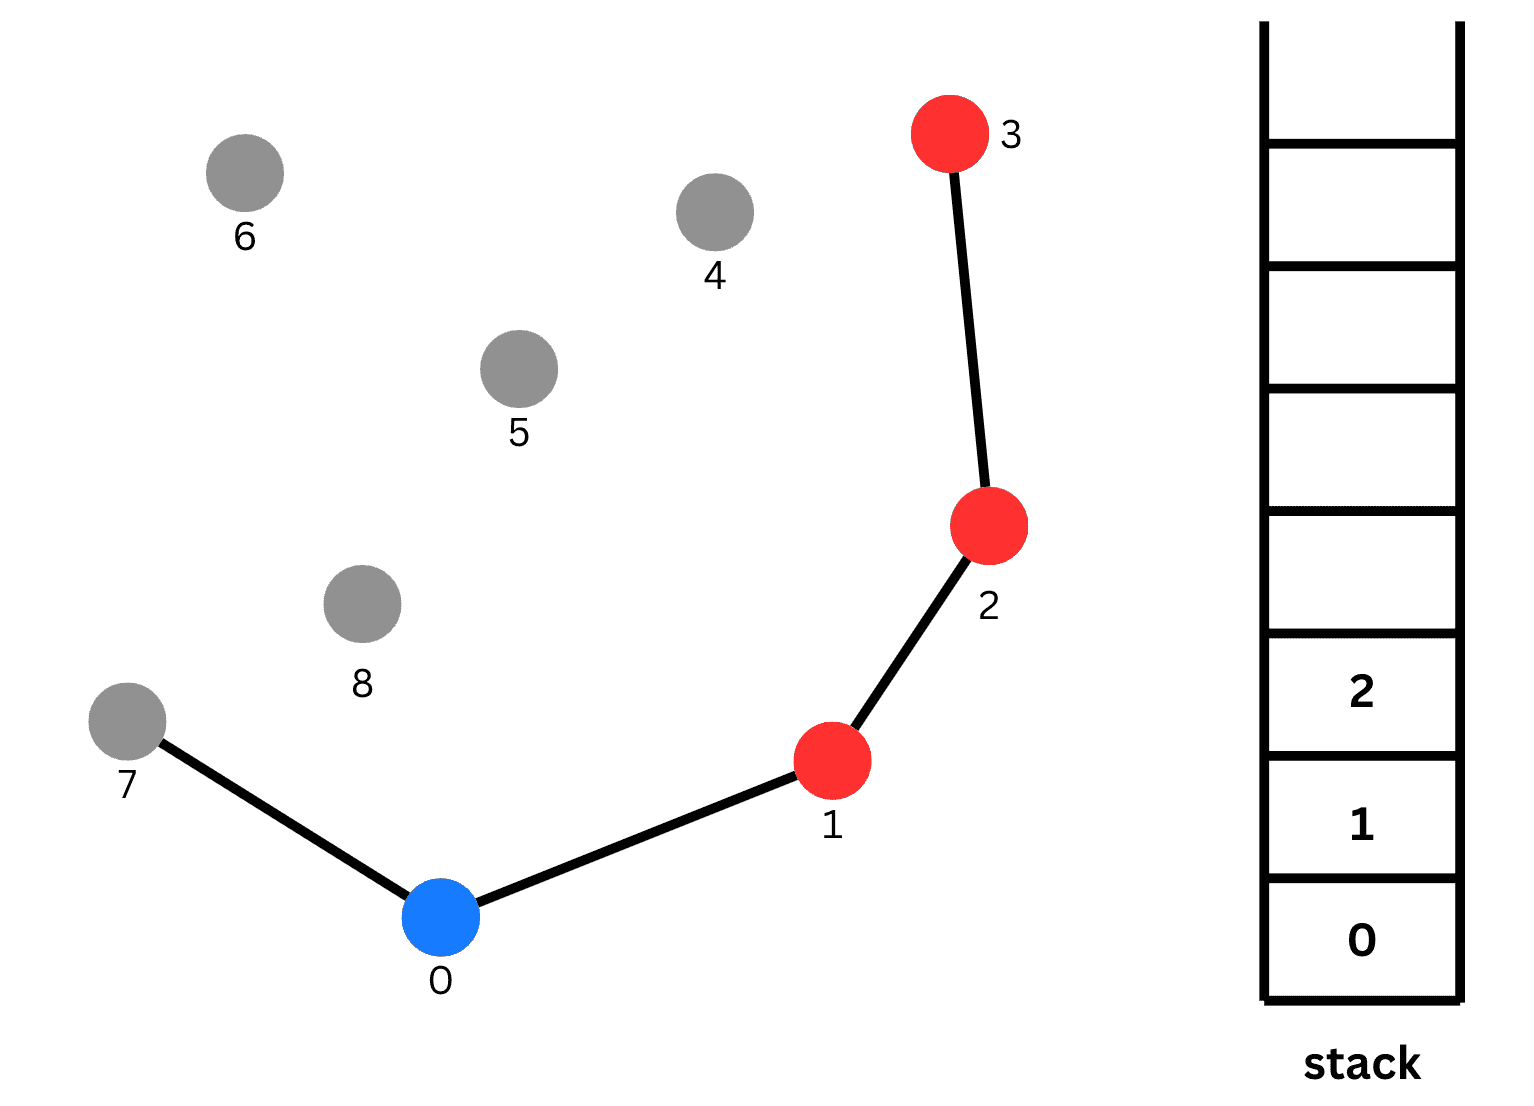
Again, we calculate the direction of the turn between 1→2 and 2→3. It satisfies our condition, so we push 3 onto the stack. We continue in the same way, moving through the numbered points. Rather than repeat every identical case, let's look at what happens when we encounter a right turn. In the next image, the scan has reached points 4, 5, and 6.
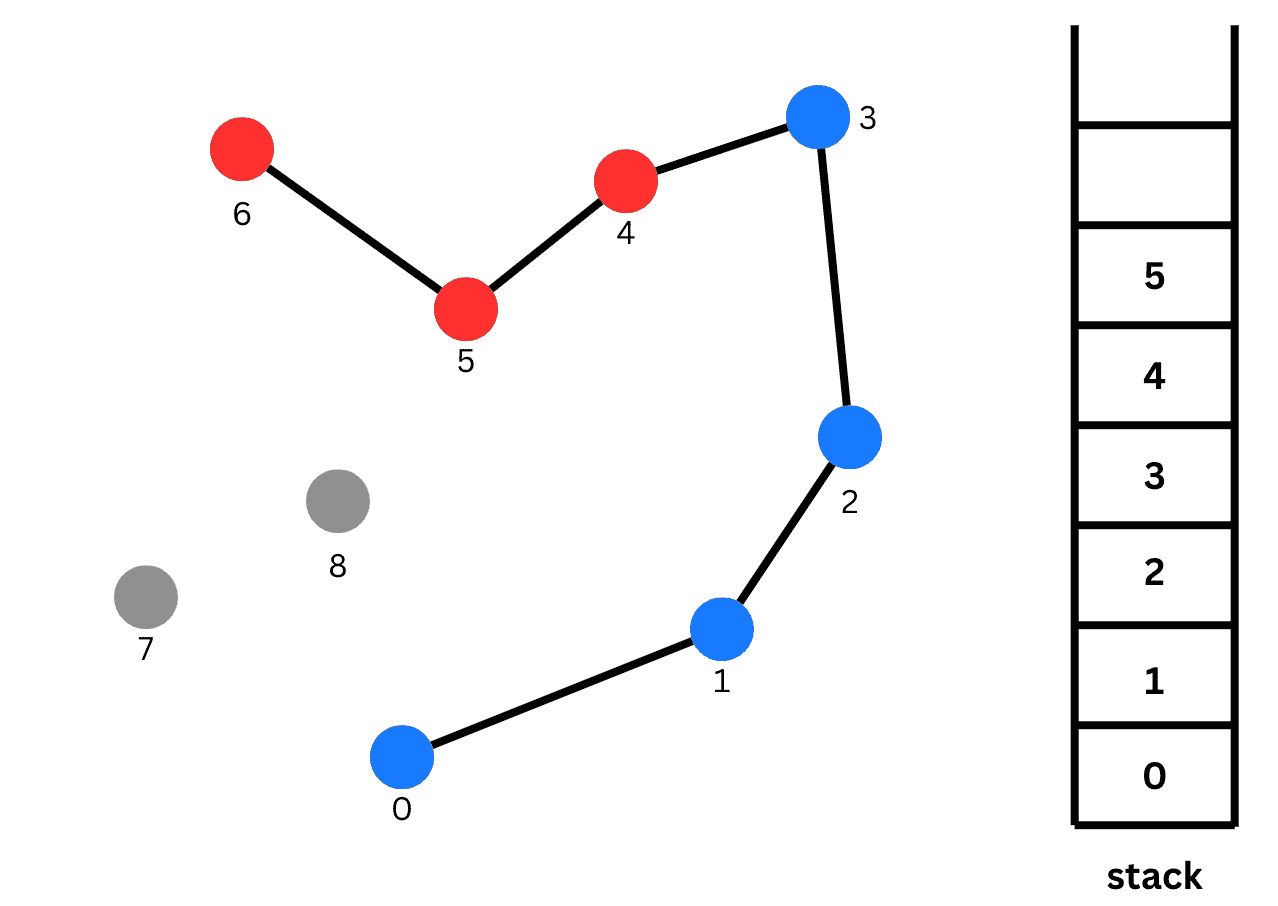
The stack already includes point 5, and we're evaluating point 6. Comparing 4→5 with 5→6 reveals an outward angle—a right turn. That means point 5, at the top of the stack, is not part of the convex hull we want. We remove it.
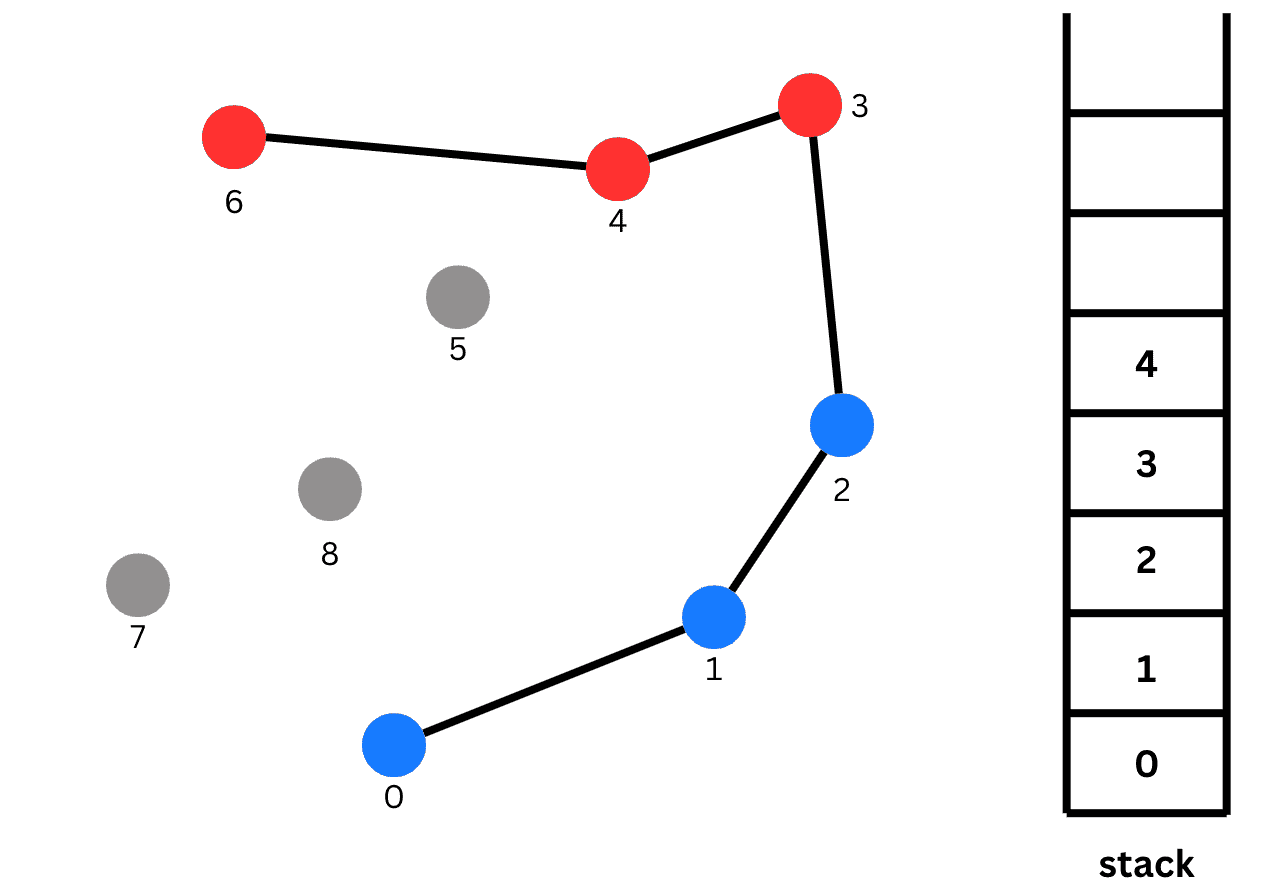
The angle between 3→4 and 4→6 also points outward. Point 4 therefore isn't part of the convex hull either, so we remove it from the stack.
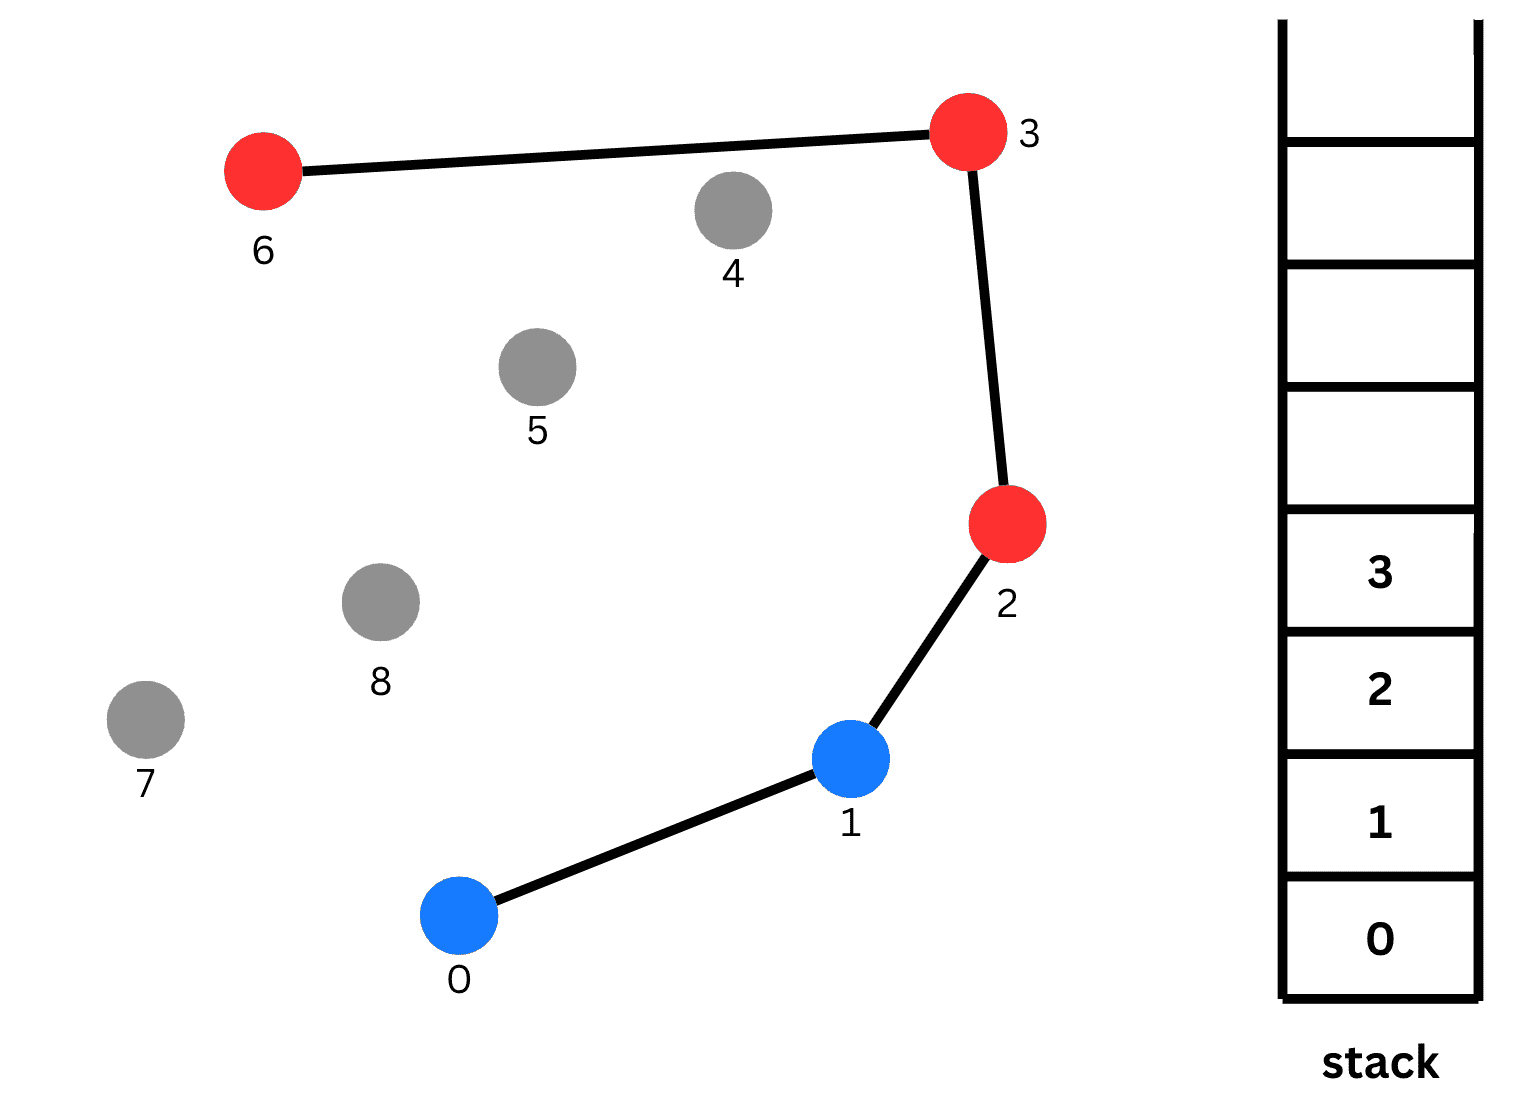
Now the angle between 2→3 and 3→6 points inward. We add 6 to the stack and move on to point 7. The following images show the remaining steps without further explanation.
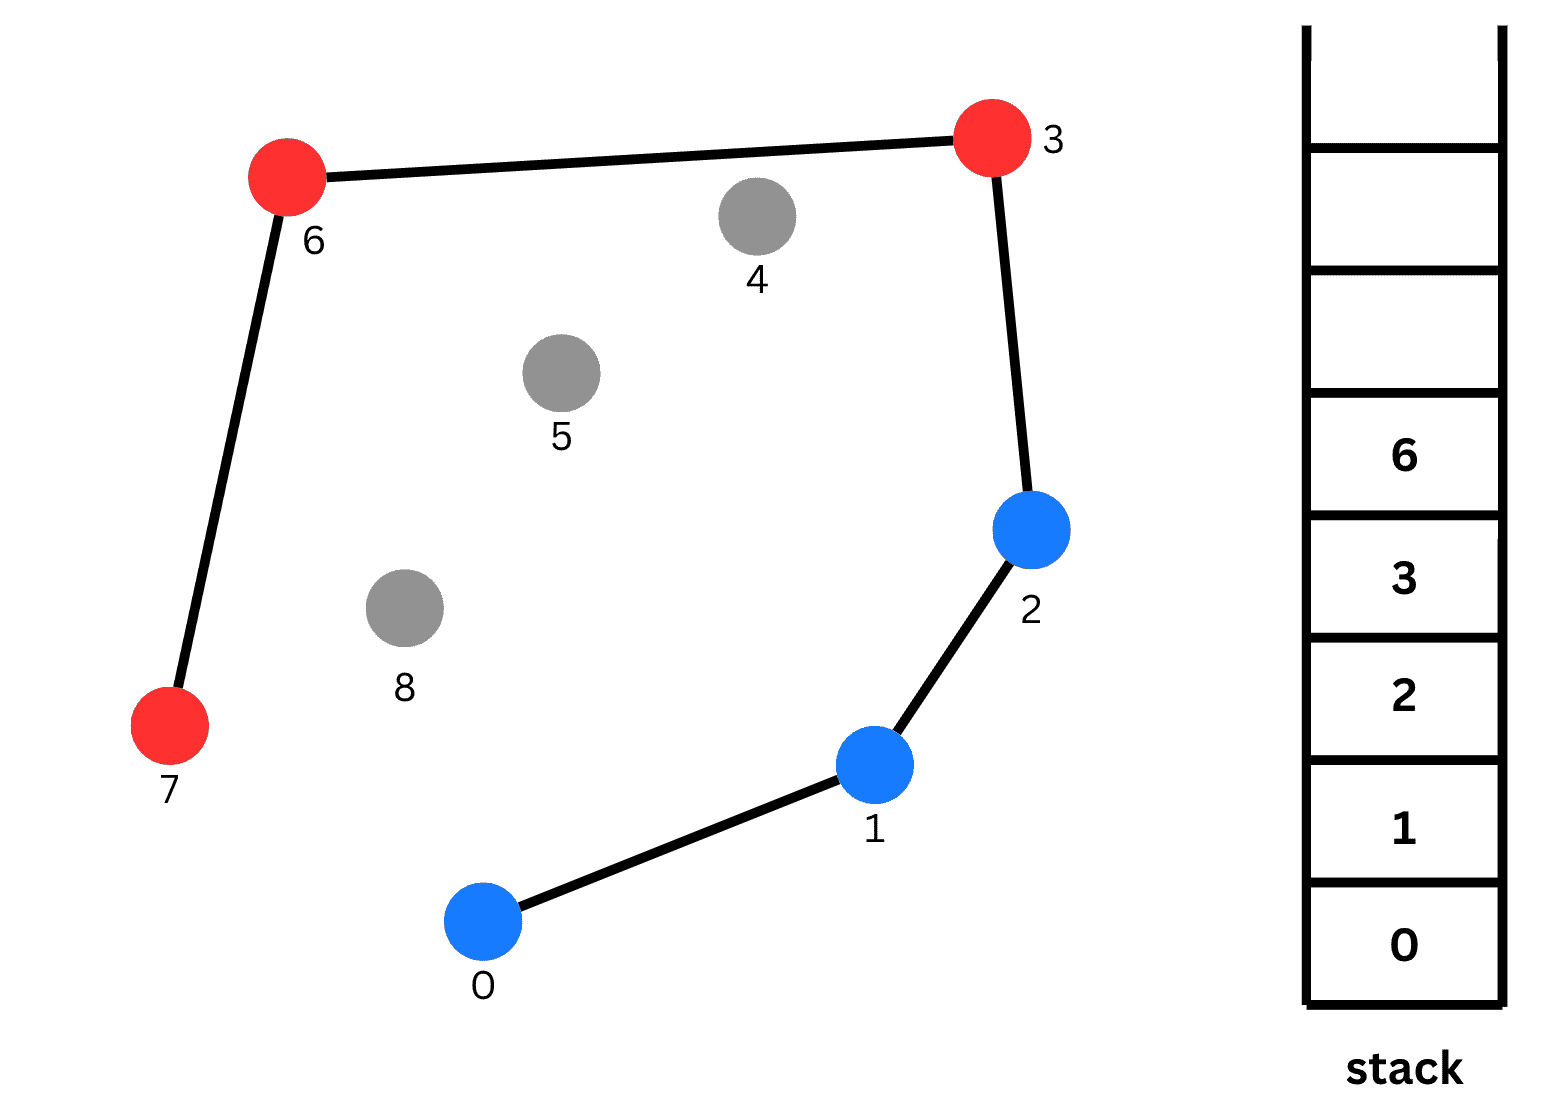
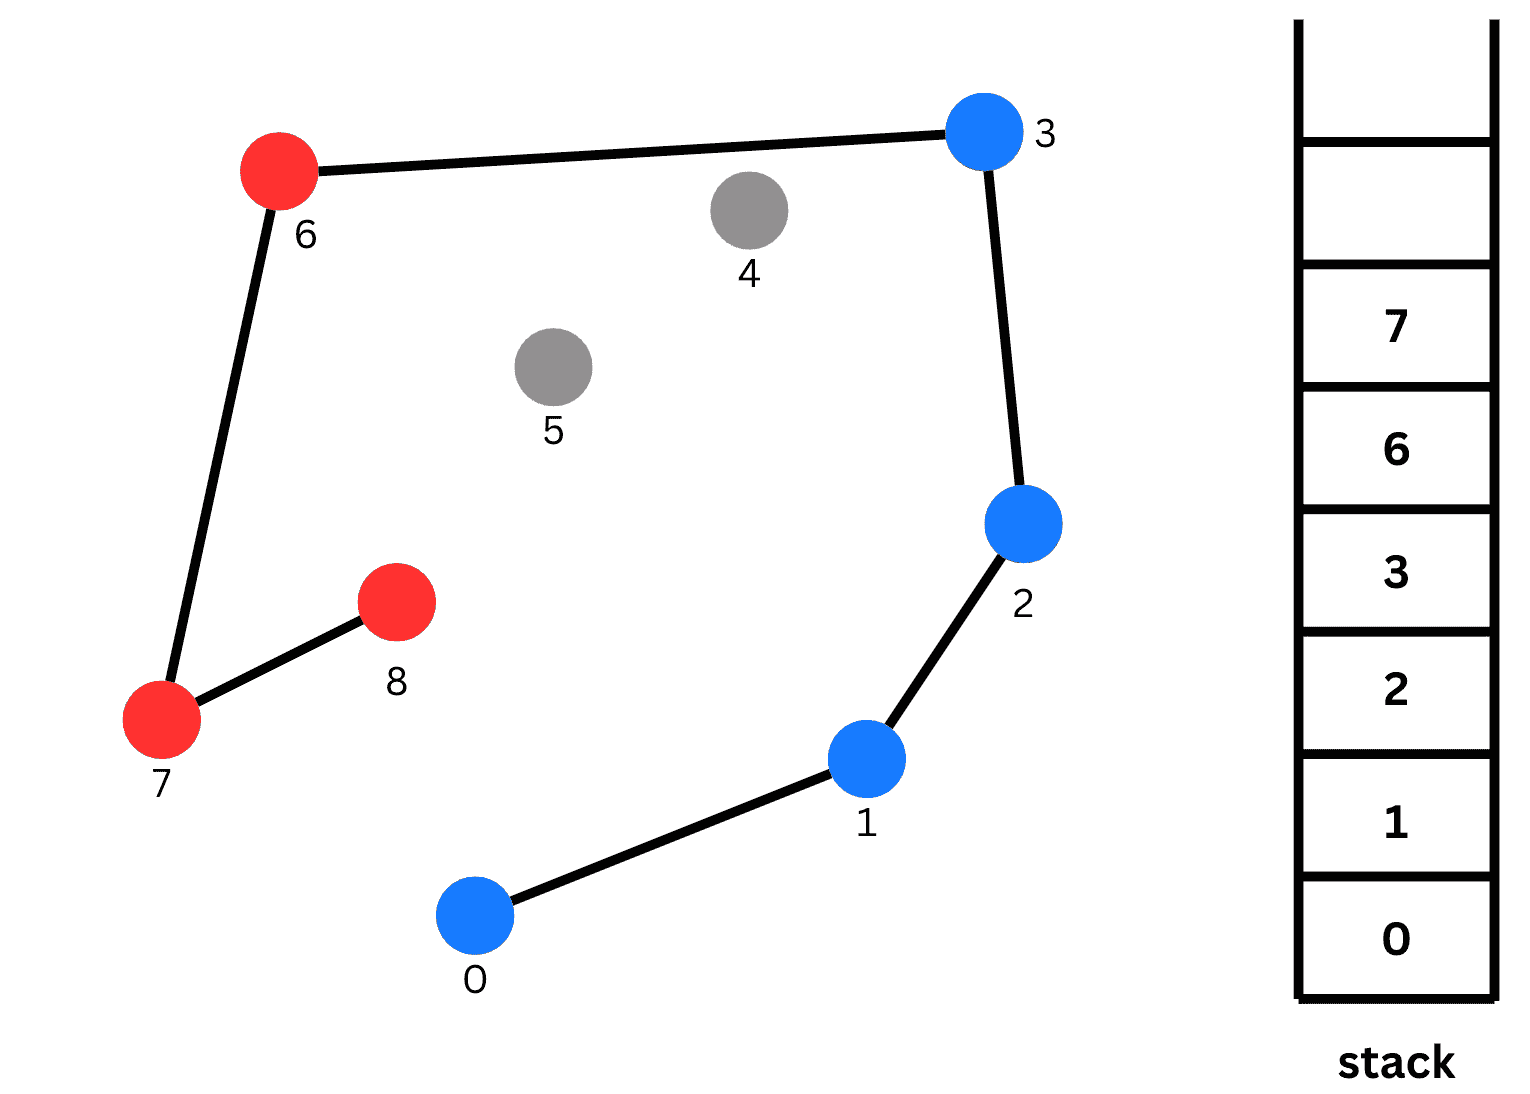
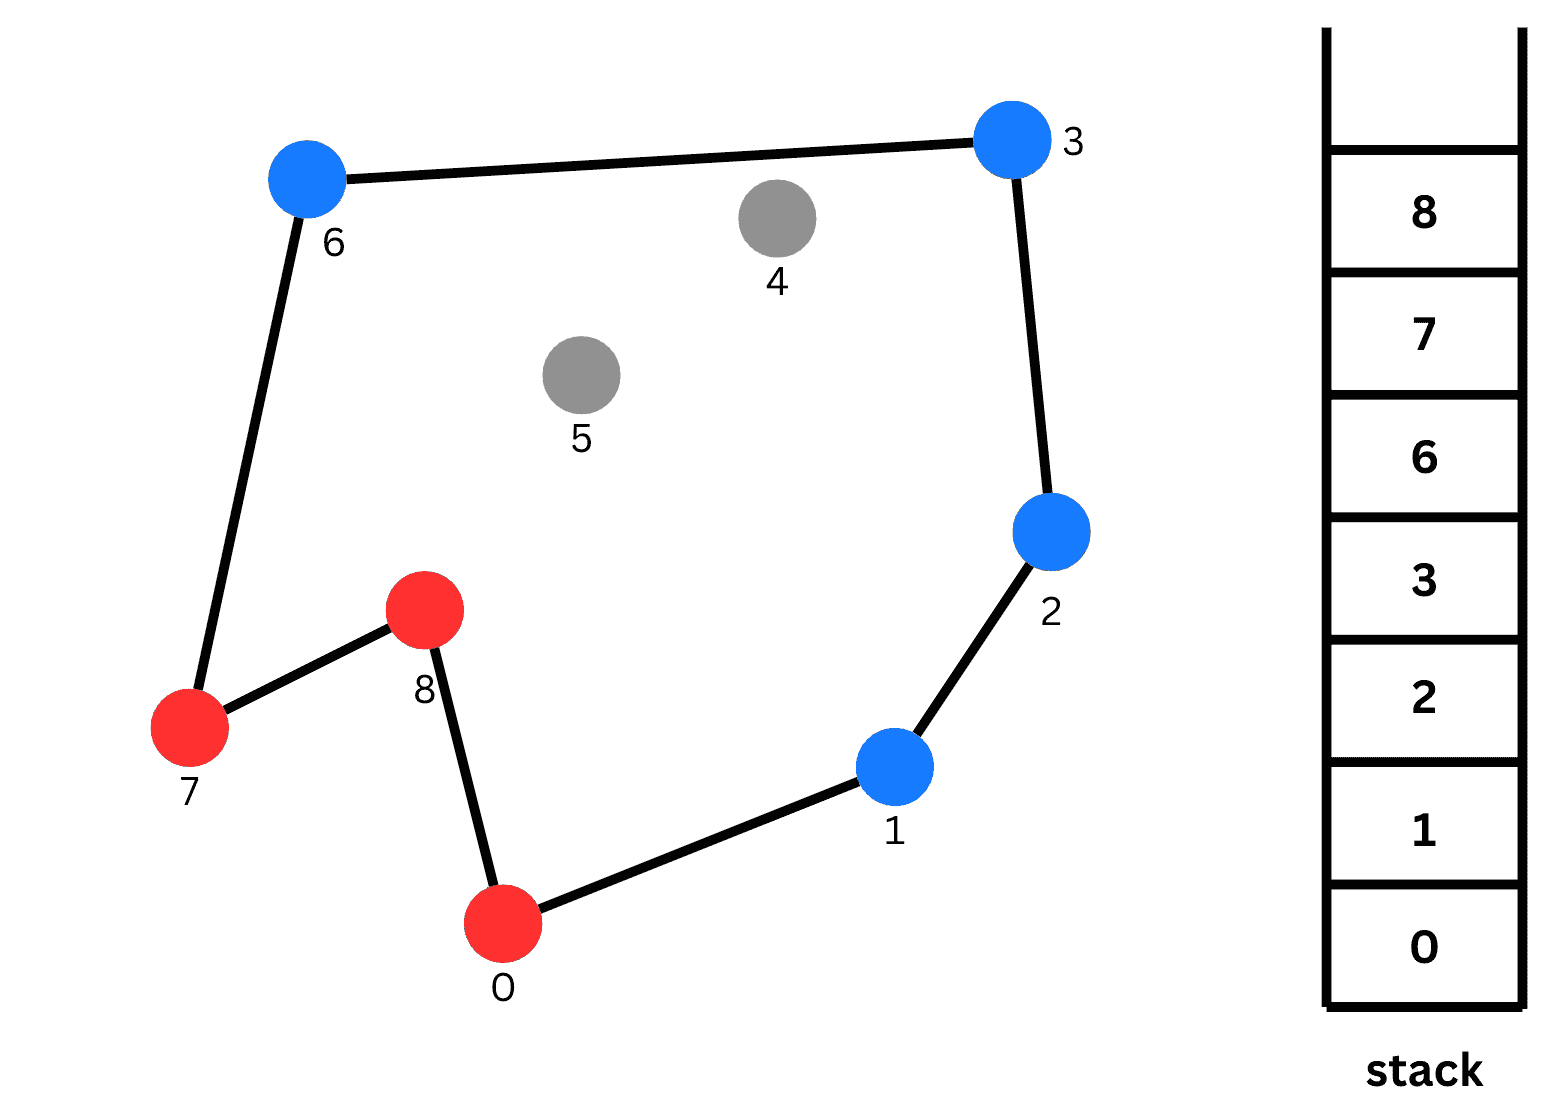
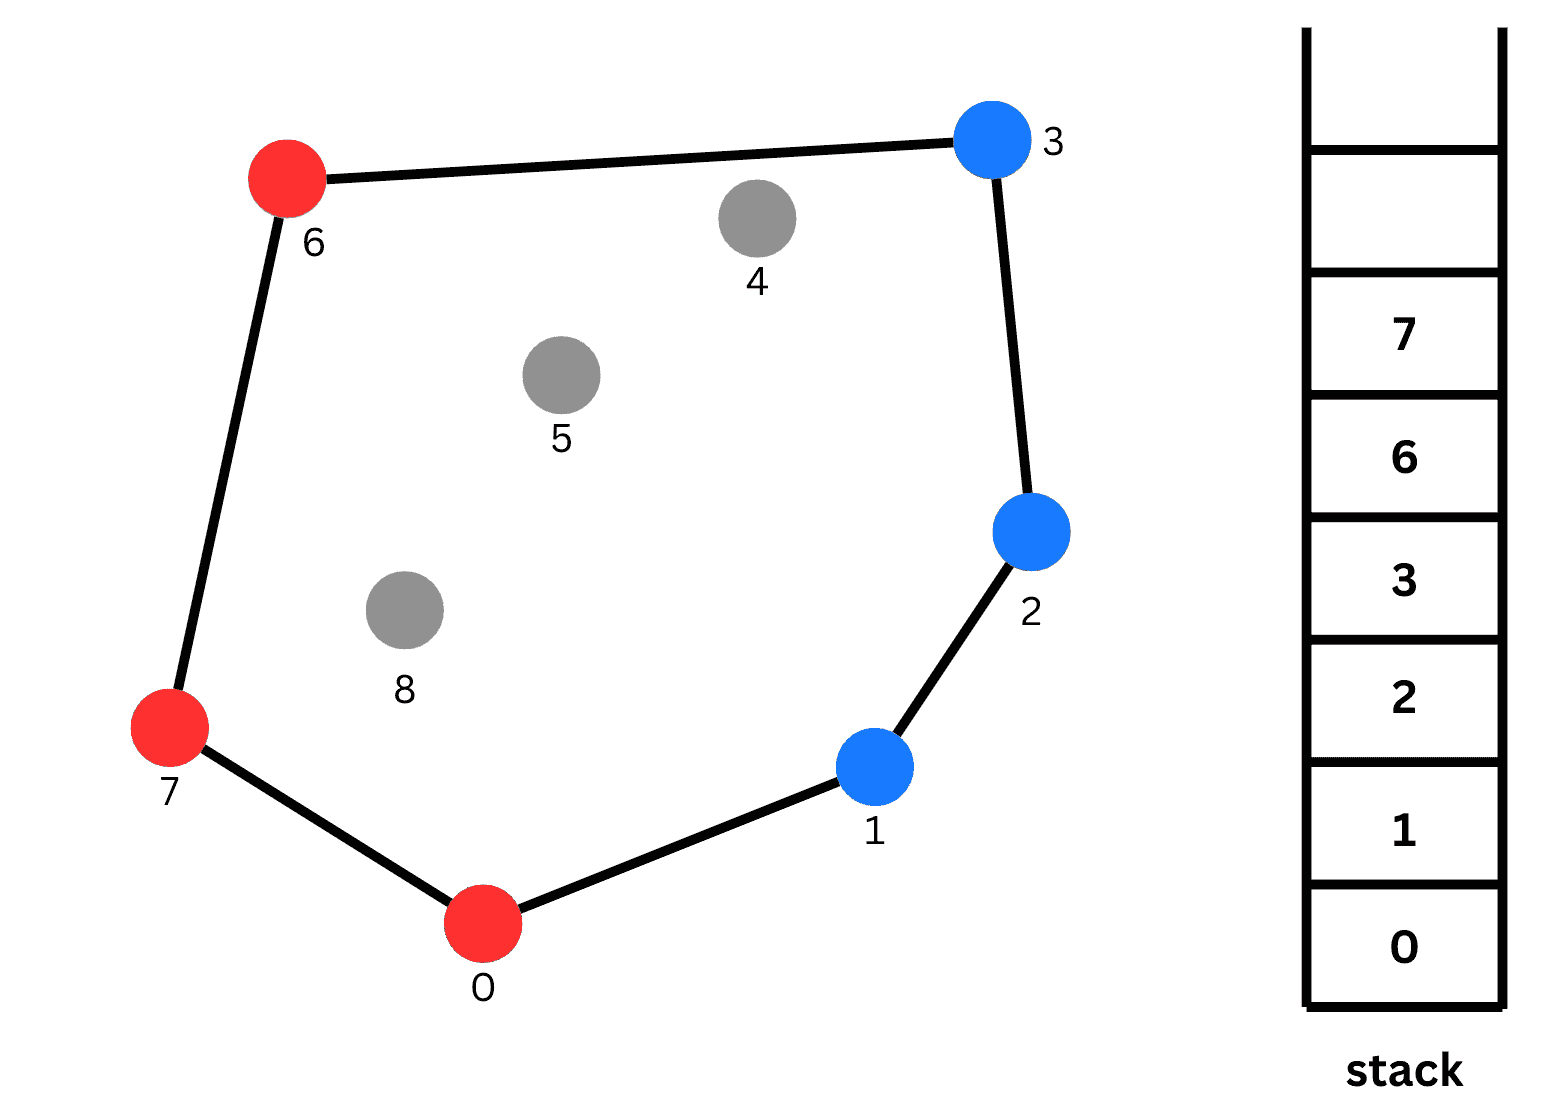
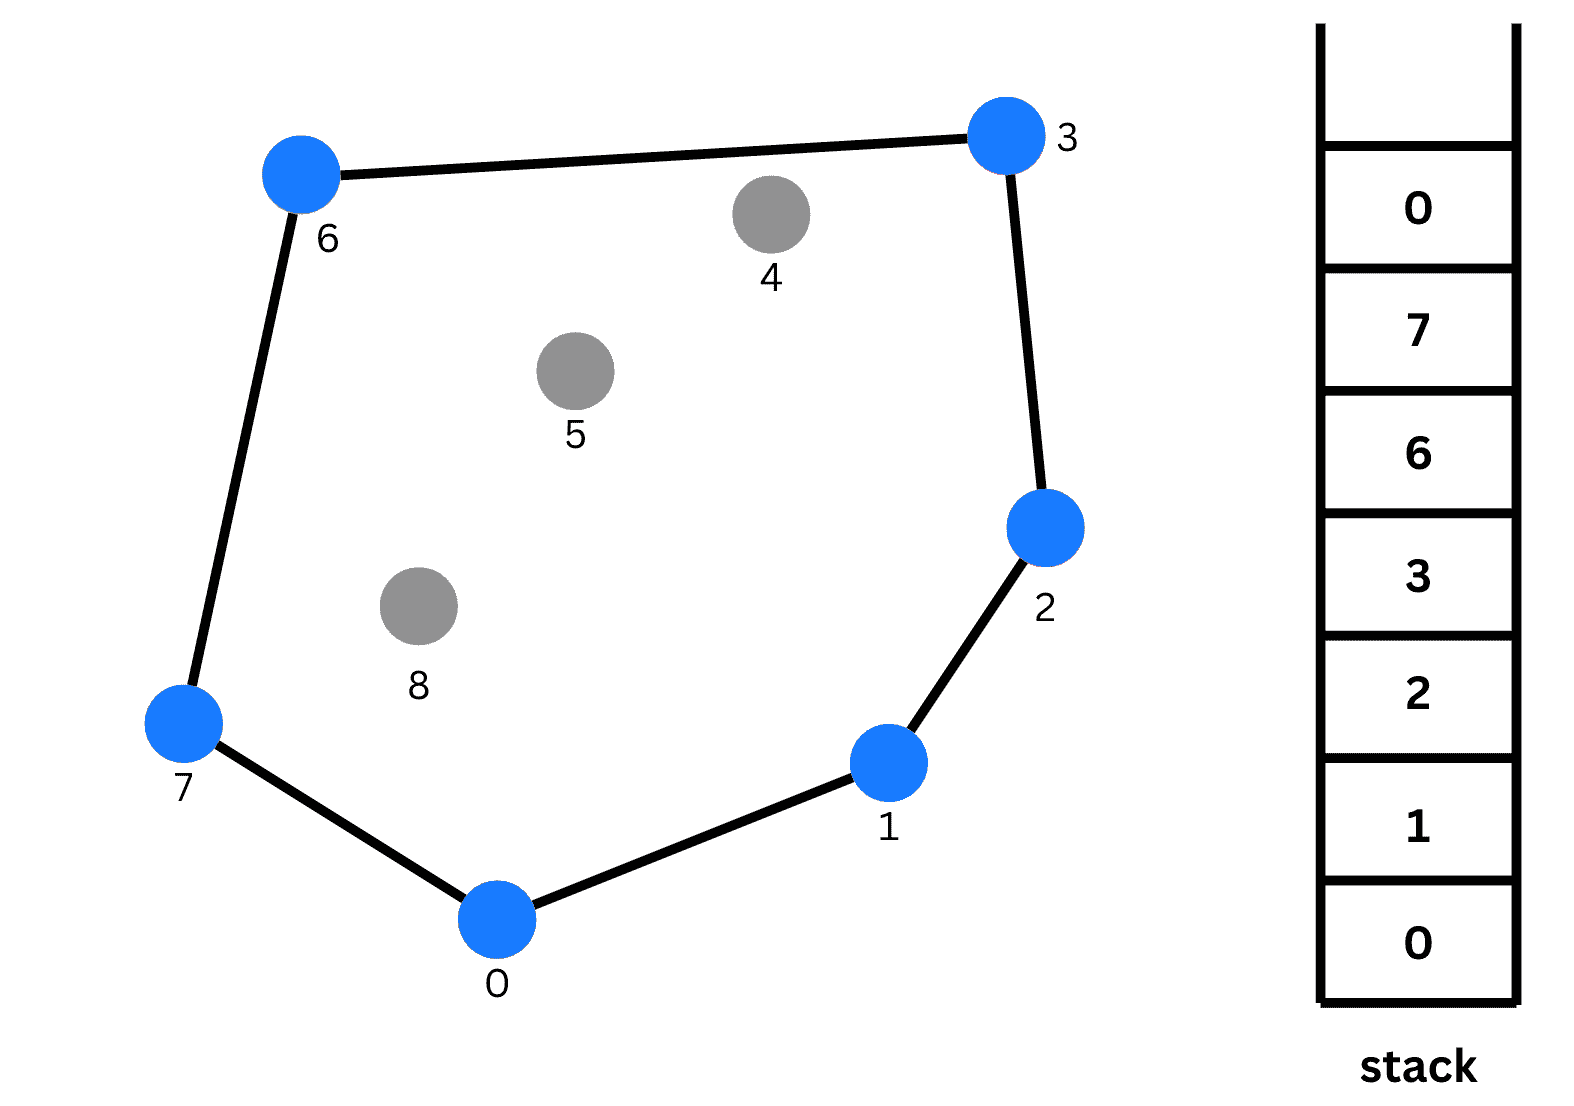
The algorithm finishes once we've examined every point and returned to the starting point. We now have the set of points forming our convex hull: [0, 1, 2, 3, 6, 7].
You could implement the algorithm yourself, but Python's Shapely library already provides a convex hull function. We applied it to every administrative area in South Korea. The difference was immediately visible.
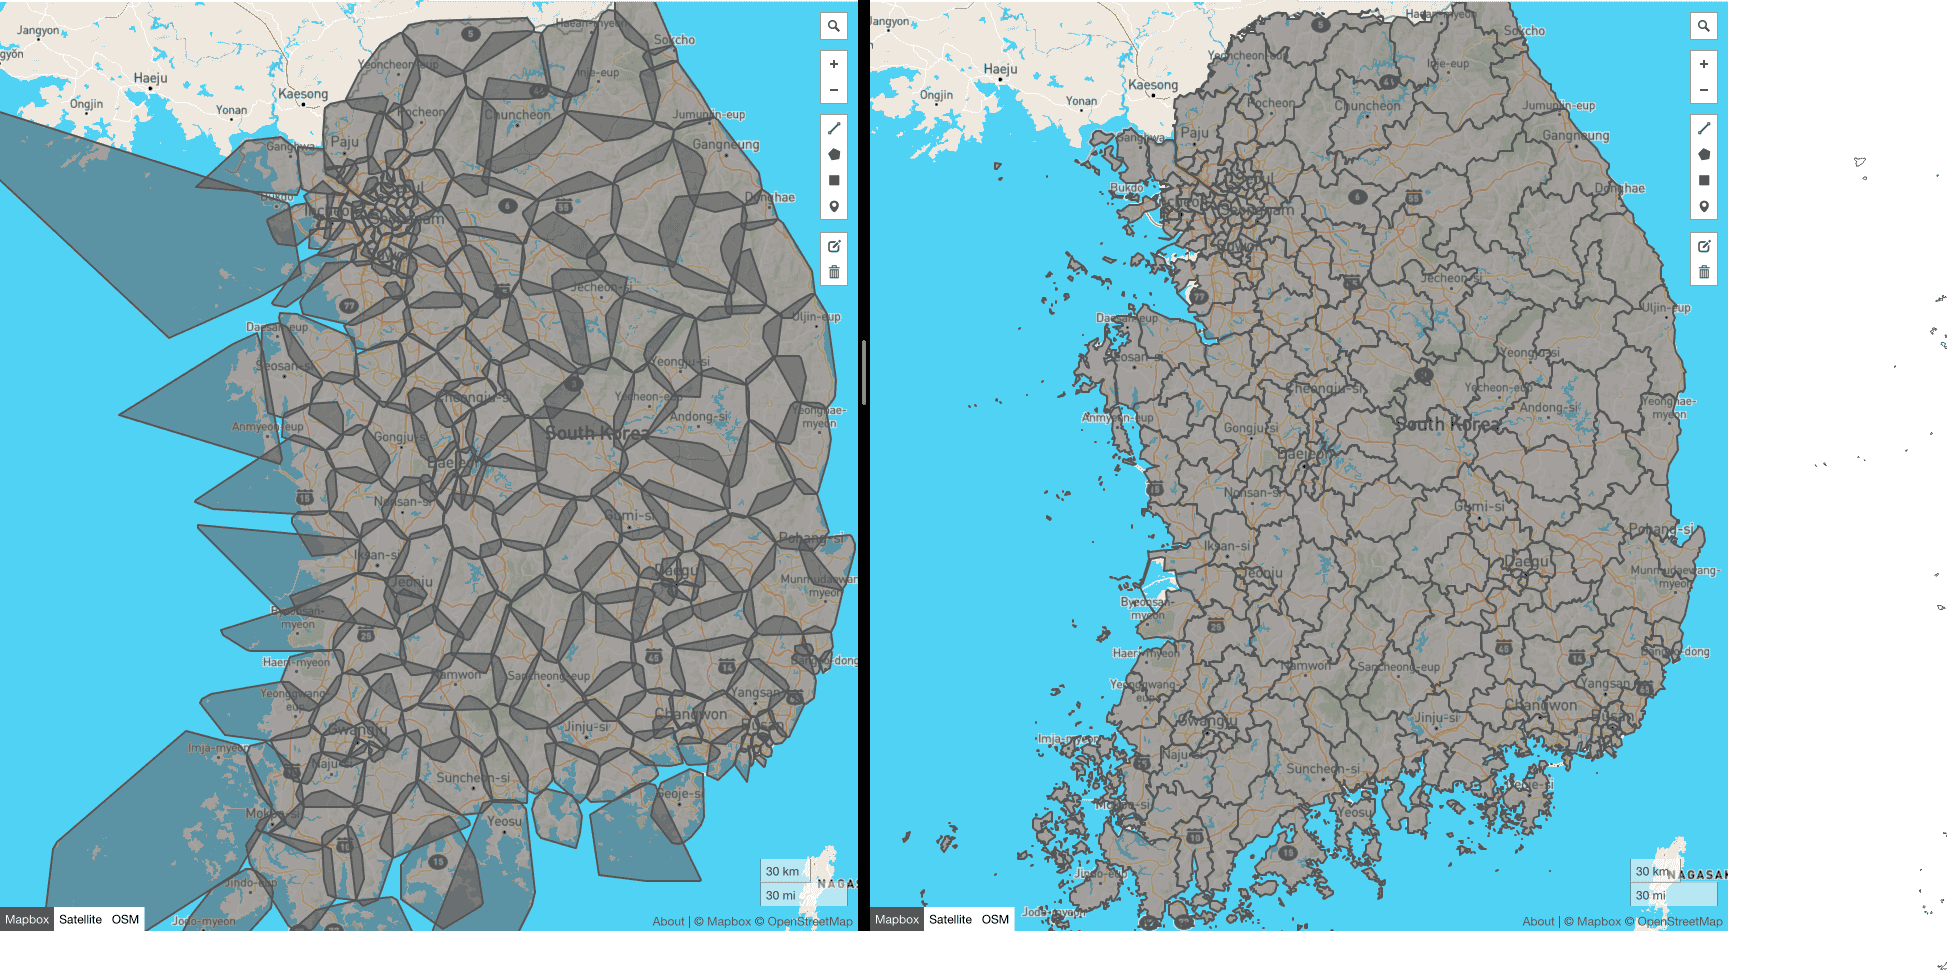
This reduced the database file containing all South Korean areas from 4.9 MB to 262 KB, a reduction of approximately 94.7%. Even the largest area's data shrank to 3 KB. With the original 1 MB limit, we could now add more than 300 areas to a targeting configuration. Since South Korea has around 250 cities, counties, and districts, that effectively removed the limitation.
The Drawback
There was one clear downside: as the images show, some areas now overlapped. Those overlaps could make geographic targeting inaccurate and introduce errors in ad targeting. In less densely populated parts of the country, that wasn't a major concern. Seoul was a different story.
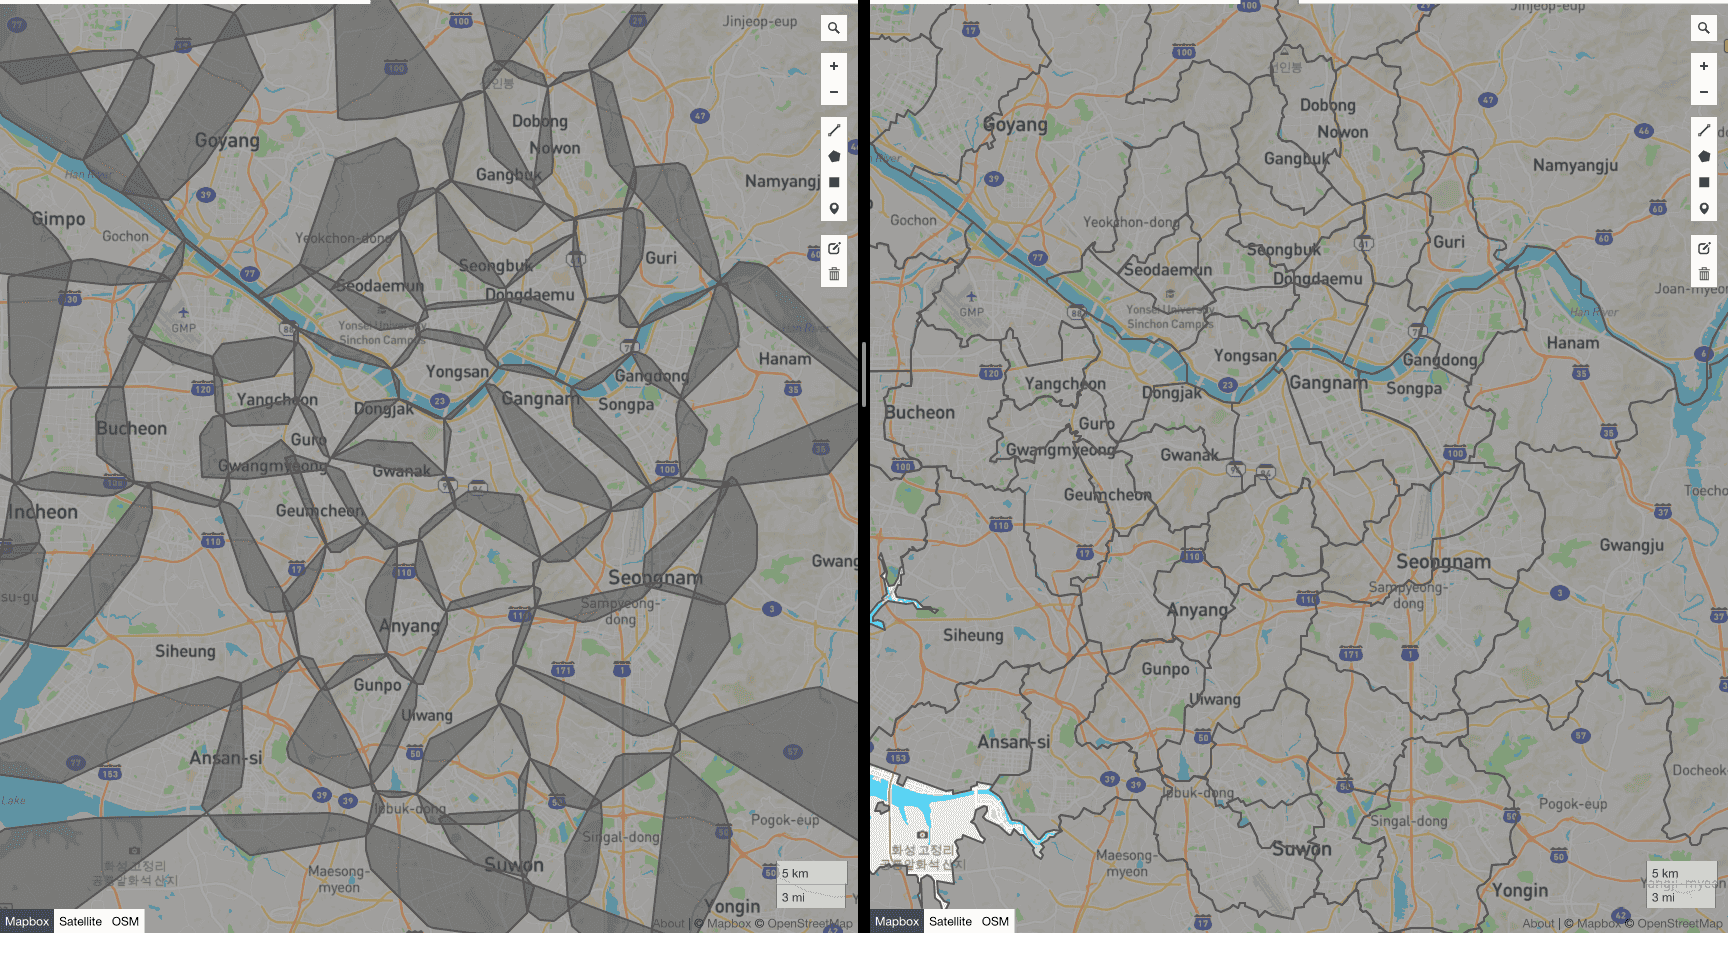
Reducing file size by more than 90% would be pointless if the resulting inaccuracies broke the feature, so we needed to validate the approach. An ad campaign happened to be targeting Seocho, Gangnam, and Songpa, so we applied the new version of geographic targeting to it.
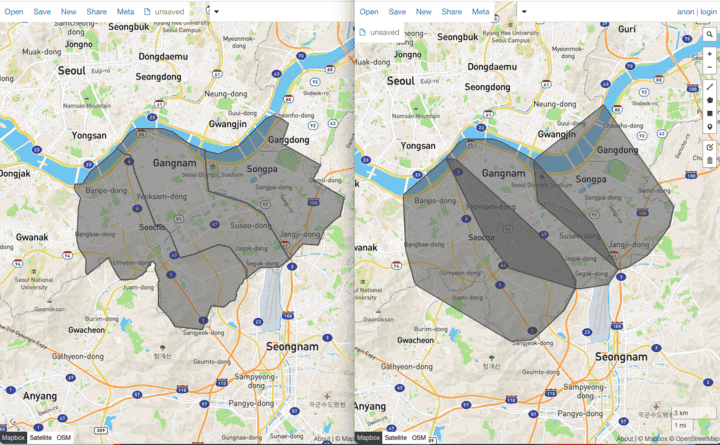
The ad was allocated 445,185 times in total. Of those, approximately 29,419 allocations were detected in Gangdong-gu, outside the targeted area: 6.6%. We also examined allocation locations for another ad targeting Daejeon and found an error rate of only 0.5% outside Daejeon. Looking at earlier campaigns, we found that allocations outside the target area had already accounted for around 1–2%. In other words, the additional error was at most about 4–5%. The team considered that an acceptable trade-off for the roughly 95% storage reduction and associated performance improvement, and we successfully rolled it out to the product.
Looking Back
There are certainly things I wish we'd done better. Given more time, I think we could have handled the overlapping sections of the convex hulls more carefully. Of course, that would have required decisions about data size and the ambiguous spaces between areas, and I know it would have taken more time than it might initially seem. Still, as a developer, it's hard not to wish we'd gone further.
I also learned firsthand how important a good test environment is. This was my first project involving ad allocation, and we were missing several things needed for QA. The geographic data service's staging environment wasn't properly configured, and even figuring out how to get an ad allocated to a test phone was difficult. Fortunately, our QA manager helped us through it and we completed the project successfully. It taught me that delivering projects quickly and accurately depends on having a well-prepared test environment.
One Last Thing…
More than a year has passed since I decided to write this post for the tech blog. I suspect everyone reading this has something they've been meaning to do for a long time. It's a little embarrassing to say so when I've only just put down my own long-carried burden, but I hope this is the year you finally put yours down too. Thanks for reading!