AI-translated. Read the original in KoreanEmbedded slides, videos and images remain in their original language.
Same Animation, Different CLS: Exploring Why Transforms Are Excluded

Frontend Engineer
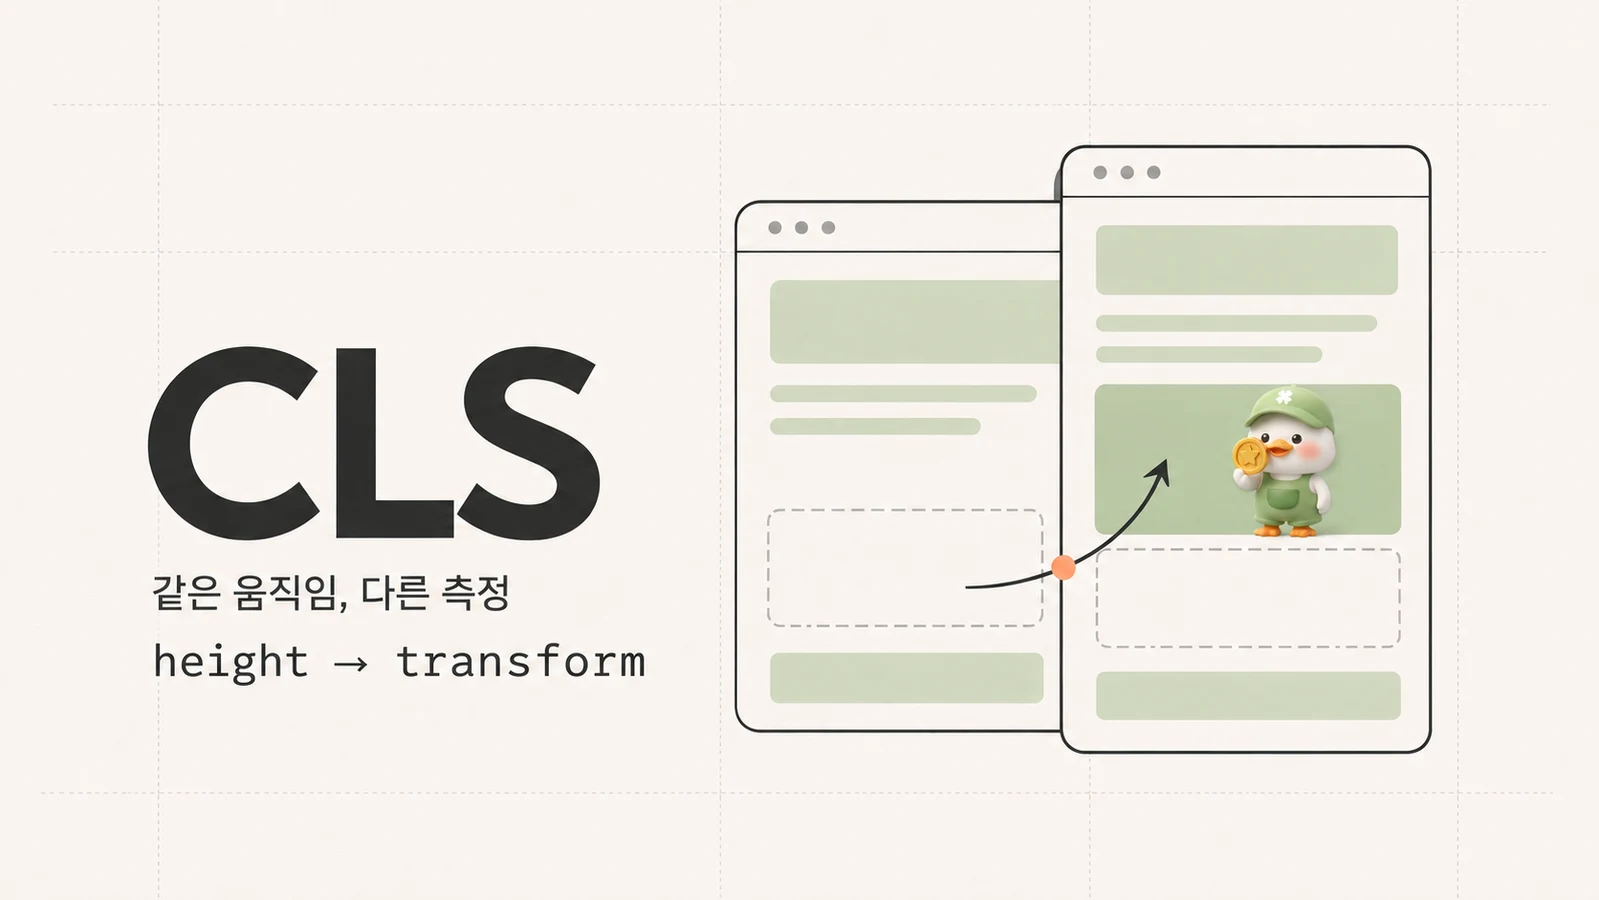
While monitoring a recently released product in Datadog, I noticed that its CLS was poor. I looked at the actual screen again, but the problem was not immediately obvious.
Tracing when the layout shifts occurred led me to the point where the goose area shrinks after a mission is completed. As its height decreased, the layout positions of the content below it changed too, so the reason the shifts were recorded was clear. But one question remained: if I recreated the same visual sequence using transform, why would CLS, a measure of visual stability, give a different result?
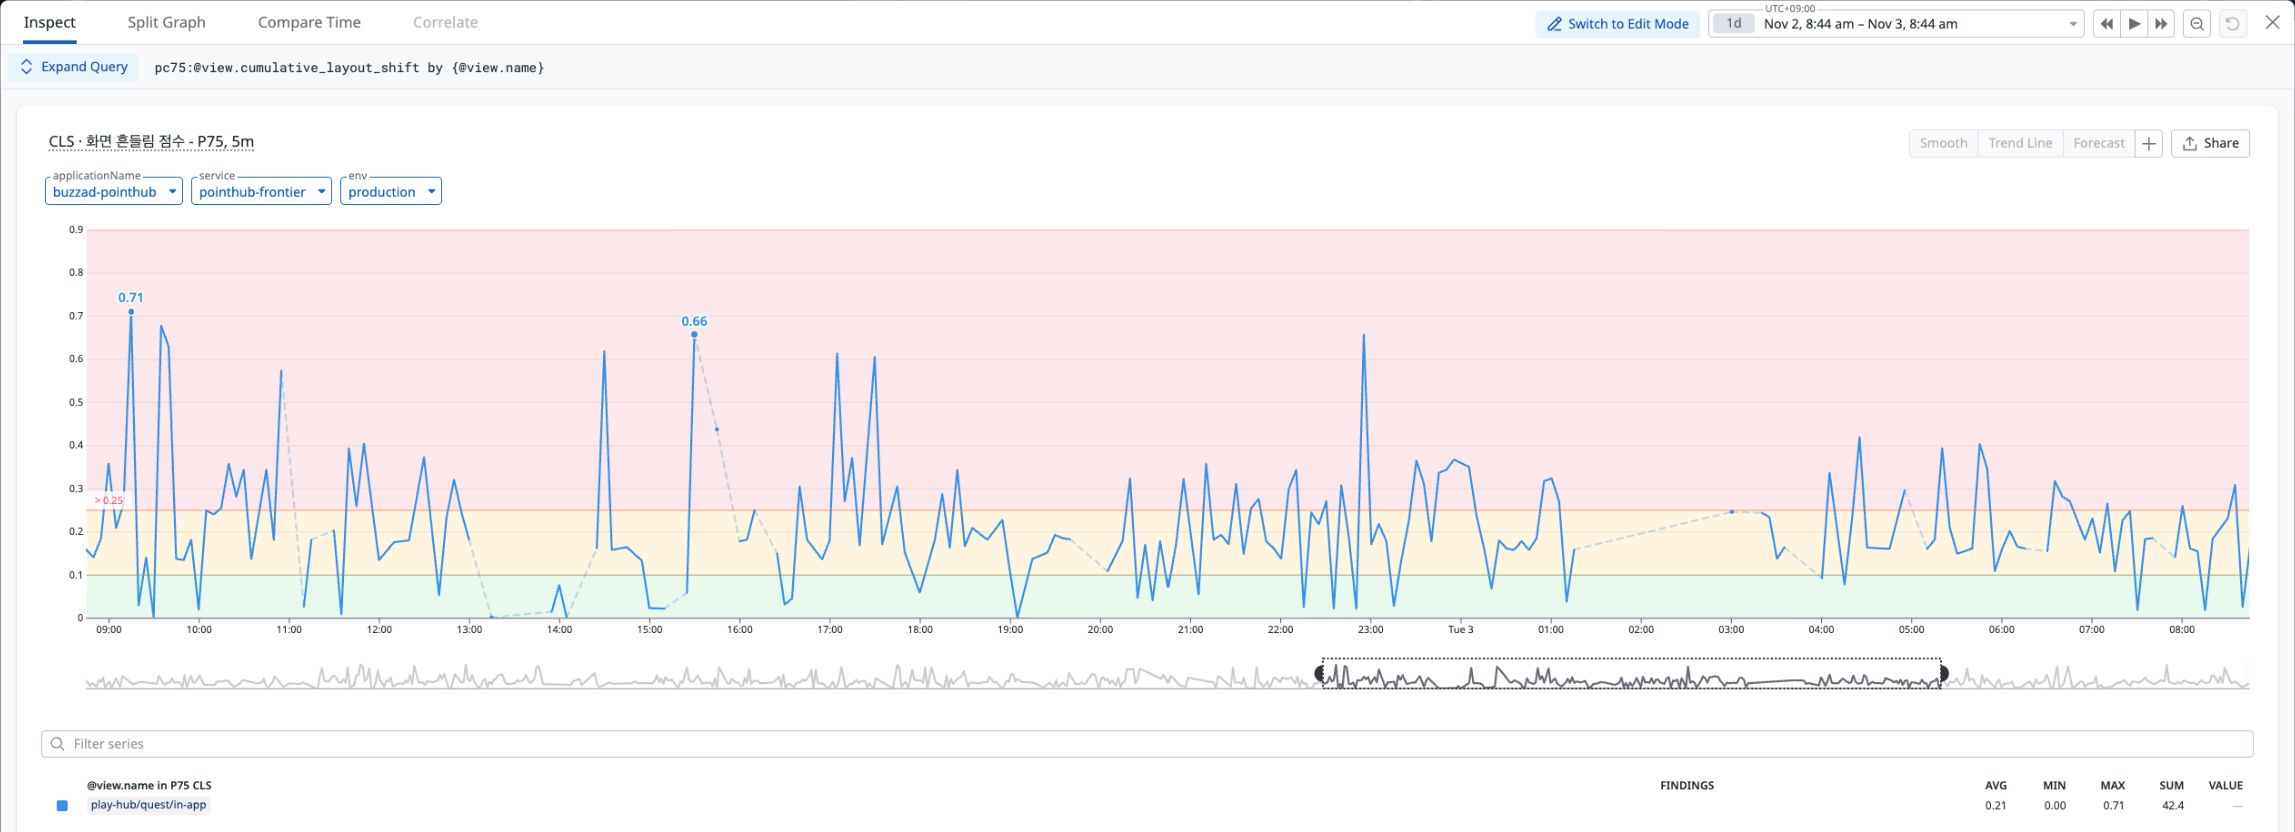
November 2, 2026, at 08:44 to November 3 at 08:44, Korea Standard Time. This screenshot shows that period retrieved from the current dashboard, with P75 calculated in five-minute intervals.
Why the goose area shrinks after a mission
The goose is a character that occupies a large part of this screen. After a mission is completed, I reduced the goose area to help users turn their attention to the other content below.
An abrupt change in screen height would feel awkward, so the content below moves up smoothly as the goose gets smaller. The sequence was intended to show the completed state and lead naturally to the next action.
The original implementation animated the area's height from 513px to 294px. As it took up less vertical space in the document flow, the content below moved up by the difference: 219px. It looked smooth on screen, but the browser recorded the existing elements repeatedly changing position during the animation.

The original height-based animation.
I did not want to remove the movement just to lower the metric. Nor could I ignore the measurement simply because the animation was intentional. Managing CLS matters because users need a stable screen to read and interact with. If we accept high values as normal because of an intentional animation, shifts that actually disrupt reading or clicking can become harder to distinguish and notice. I therefore decided to find a way to lower CLS while keeping the same flow.
The layout shifts CLS measures
CLS measures visual instability caused by unexpected layout shifts. Typical examples are a button moving just as you try to press it, or a sentence shifting while you are reading it.
The browser looks at changes in the positions of previously visible elements between frames, then calculates a score from the affected screen area and the distance moved. It groups successive shifts into time windows and uses the highest-scoring window. To understand how a particular action affects CLS, you therefore need to look at when individual layout shifts occur alongside the CLS value. Official CLS explanation
Moving the animation from height to transform
I moved the animation to transform to reduce the layout calculations caused by height changes. The implementation needed to separate placement in the document flow from visible movement while preserving the original visual sequence.
Scaling the entire area with scaleY could distort the text and cards as well. I therefore kept the height occupied by the final layout fixed and implemented the goose and the content below as separate moving parts. The goose changes size and position with scale and translate, while the content below moves with translateY. I also aligned the background and visible boundaries so that no white gap would appear between the two areas during the movement.
I kept the existing condition that pauses the animation while the reward overlay is visible. A transformed parent can also affect the positioning reference for fixed elements. I therefore placed the result sheet and overlay outside the moving layer and checked that they remained fixed relative to the whole screen.
Comparing the actual screens: preserving the animation while reducing CLS

Captured by running each version of the actual app. The original height animation is on the left, and the transform-based animation is on the right.
While investigating the CLS problem seen in production, I measured the goose's shrinking sequence separately in the local app. I also compared the goose's size, the position of the content below, the animation duration, and intermediate frames side by side to check that the original animation was preserved.
| Measurement | Original height animation | Transform animation |
|---|---|---|
| CLS during the observed animation interval | 0.104 | 0.000 |
The transform-based implementation recorded no layout shifts during the observed interval.
I ran the local app in Chromium at 390×844 and measured the interval from 0.2 to 4.2 seconds after the goose area appeared, using the CLS session window rules.
Performance measurements: less browser work too
To check browser work time alongside the change in CLS, I profiled the animation interval. These measurements were taken while changing the animation implementation. In a local Next.js development environment, using Chrome at 390×844, I measured the one-second interval after shrinking began. The table below shows the median of two runs for each version.
| Measurement | Before | After |
|---|---|---|
| Layout count | 46.5 | 4 |
| Total Layout time | 4.77ms | 0.48ms |
| Total Script time | 227.65ms | 40.00ms |
| Total style recalculation time | 11.56ms | 20.62ms |
| Increase in TaskDuration | 300.84ms | 115.83ms |
Style recalculation took longer, but Layout and Script time decreased. TaskDuration, the cumulative time the main thread spent doing work during the same one-second interval, also fell from 300.84ms to 115.83ms, a reduction of about 61.5%. In this measurement, I was able to reduce both CLS and the browser's workload while retaining the original animation.
Lower CLS in production too
To see whether the change I measured locally also appeared in actual user views, I checked Datadog again after deploying to production on November 4, 2026, at 10:05 KST. Looking at the periods before and after deployment on the same chart made the difference visible.
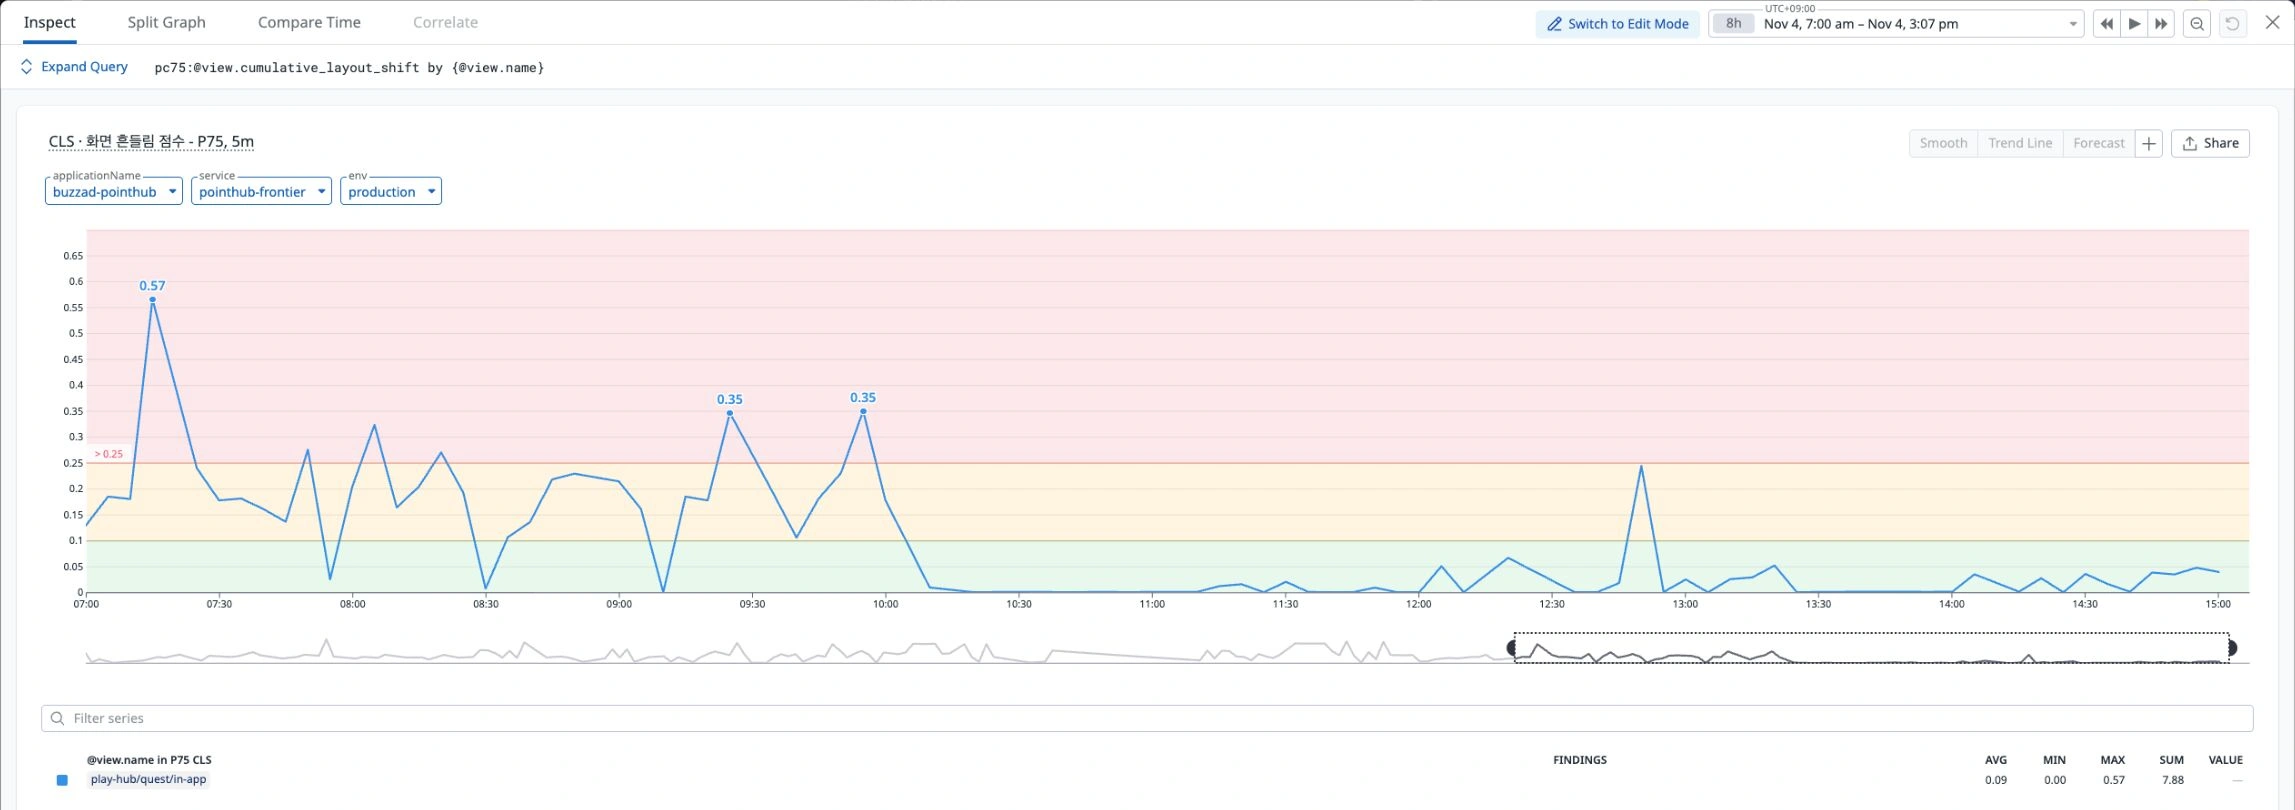
November 4, 2026, 07:00–15:07 KST. The chart shows P75 in five-minute intervals and is an interim observation from the day of deployment.
I aggregated Android views with a recorded CLS value for the same service, production environment, and in-app route. Separately from the five-minute trend on the chart, I calculated P75 and P90 across each full comparison period.
| Measurement | Before deployment | After deployment |
|---|---|---|
| Views with a CLS measurement | 113 | 152 |
| CLS P75 | 0.244 | 0.020 |
| CLS P90 | 0.364 | 0.047 |
The before period is November 4, 07:00–10:00 KST; the after period is 10:15–16:54. I excluded the most recent ten minutes at the time of the query to allow for data latency.
The lower CLS I had seen during a specific animation interval locally was also observed in the production sample after deployment. Other changes were deployed at 14:17, but P75 was already low at 0.015 across the 94 views that started before that rollout. Because the period included multiple changes, I compared production trends before and after deployment rather than isolating the effect of any one change.
Of the 152 views after deployment, three had CLS above 0.25, with a maximum of 0.690. Overall values remain lower, but some large shifts persist, so I am continuing to watch the trend under the same conditions for 24 hours.
Why does CLS exclude transform when the movement looks the same?
The implementation differences explained why the browser did a different amount of work. What I wanted to understand further was why CLS, a user experience metric, also distinguishes between these implementations.
The Transform Changes section of the WICG explainer gives three reasons for this exclusion: transforms do not reflow surrounding content, are commonly used for smooth animations, and lend themselves to hardware-accelerated compositing on a separate thread from layout and scripting. Movement caused by a transform itself is excluded; if the layout changes for another reason at the same time, that shift is still measured. Original design rationale
Google explains that well-designed animations can help users understand state changes. The goose's movement served the same purpose: showing that a mission was complete and directing attention to the content below. Explanation of animations and transitions
The WICG explainer describes these exclusion rules as heuristics that cannot be guaranteed to work well in every situation. It gives the example of a smooth carousel that can produce a high CLS when animated with left, while switching to transform can avoid that result. Original explanation of the limitations
Reading this helped me understand that rather than directly determining what users expect or find frustrating, CLS uses implementation characteristics to estimate the likely effect on their experience.
Using transform therefore does not guarantee good UX. A button that suddenly jumps without warning can still frustrate users even if CLS does not capture the movement. Conversely, an animation that helps users understand a change can affect the score depending on how it is implemented.
Closing thoughts
At first, it felt contradictory that movement intended to help users take their next action could worsen a user experience metric. I only understood the situation after examining which movements CLS includes and excludes, and the assumptions behind those rules.
The shrinking goose was intended to show mission completion and guide attention to the content below. I used that purpose as the basis for comparing the screens, then checked the effects of the implementation change through CLS and profiling. I was able to preserve the original animation while reducing layout shifts during the animation interval and the time the browser spent doing work.
Performance metrics carry assumptions about what makes a good user experience. Looking at those assumptions in the context of a product helps distinguish the problems the numbers reveal from aspects of the experience that scores alone cannot explain. Exploring the design rationale behind CLS helped broaden the basis for that judgment.