AI-translated. Read the original in KoreanEmbedded slides, videos and images remain in their original language.
Responding to an RDS MySQL IOPS Incident

Software Engineer
This post describes a memory problem we encountered while running an AWS RDS MySQL database at Buzzvil, and how we resolved it.
Introduction
Hi, I’m Summer, an engineer at Buzzvil. At the time of writing, Buzzvil’s ads reach around 20 million monthly users, and our servers receive roughly 7 billion ad requests a month. Among our microservices, the service that looks up users making ad requests handles about 5,000 requests per second. Here, I’ll share an incident involving that user service’s AWS RDS database and what we learned while resolving it.
The incident
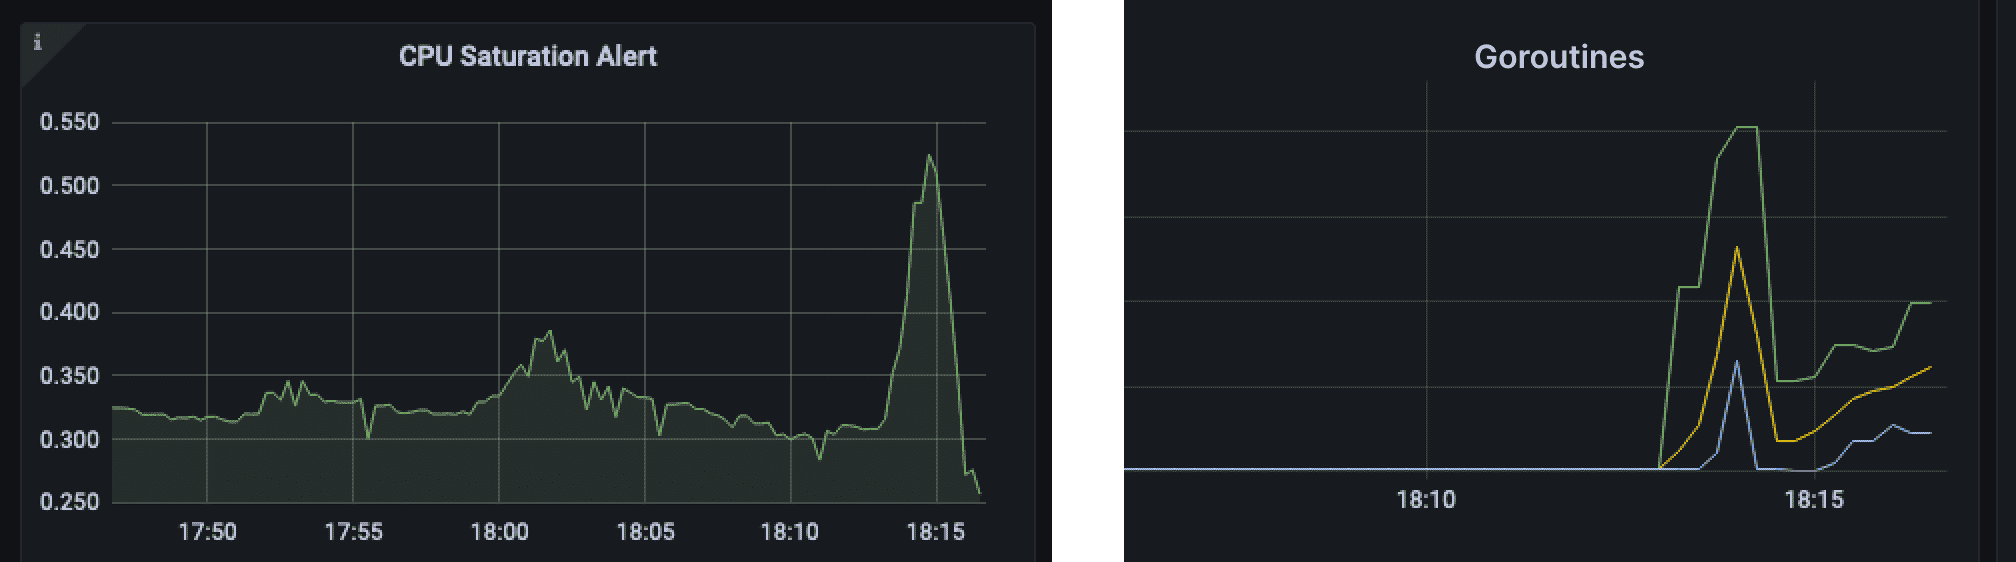
It began just before the end of the workday—of course—with a Slack alert that the user service’s error rate had risen. Metrics showed CPU throttling, rapidly rising memory usage and goroutine counts—the service is written in Go—and a spike in connections to the MySQL replica.

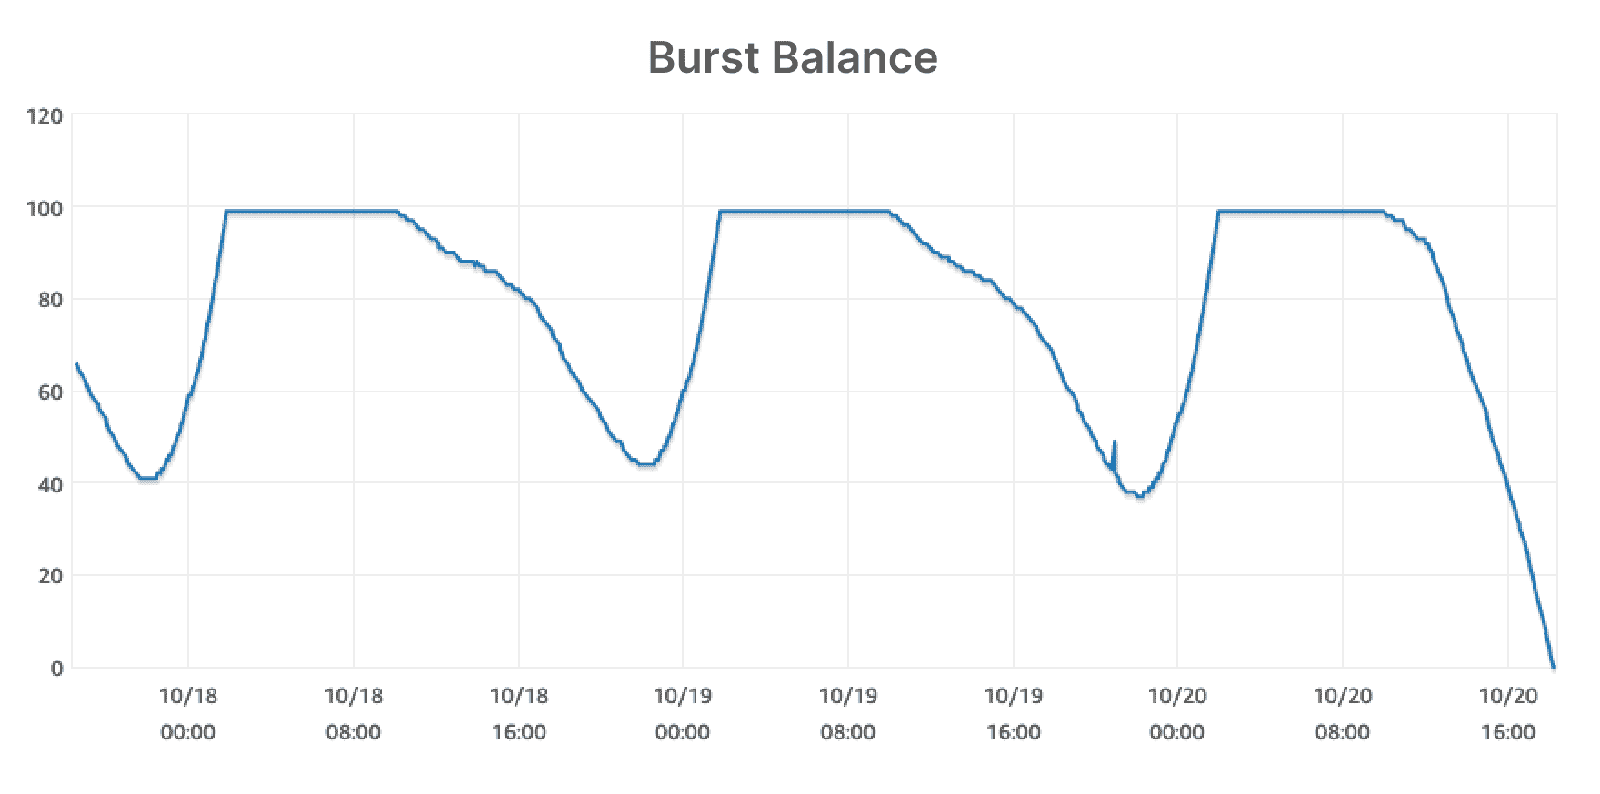
Suspecting the replica, we checked RDS monitoring. IOPS had risen, draining the burst balance to zero and causing database performance to deteriorate sharply. With the tight timeouts required in advertising, the user service was returning timeout and database connection errors. On the instance’s gp2 volume, burst capacity was tied to RDS storage size. Although we weren’t running out of storage space, increasing storage let us resolve the immediate incident quickly.
Investigating the high disk I/O
The service recovered after we increased storage, but the question remained: why was RDS disk I/O so high? Looking at burst balance over three days, we saw a repeating pattern of depletion and recovery. During the day, more ad requests meant more user lookups and sustained consumption of burst balance. The volume of IOPS seemed suspicious, so our team investigated.
The following graph shows the user service’s IOPS over the previous year. It had roughly doubled from 1,000 to 2,000 and continued to trend upward. With about 5,000 requests per second, read IOPS of 1,000–2,000 also represented a high ratio of I/O to requests.

High disk I/O harms database performance, and IOPS beyond certain limits can incur additional AWS charges. We first hypothesized that frequent cache misses were causing the I/O and calculated MySQL InnoDB’s buffer pool hit ratio. The buffer pool caches data and indexes in memory. A low hit ratio means more data must be loaded from disk into the buffer pool, explaining high disk I/O caused by cache misses.
1 - (innodb_buffer_pool_reads / innodb_buffer_pool_read_requests)
Source:
Key components of InnoDB
This calculation gave us a 98% hit ratio. Cache misses weren’t especially frequent, yet disk I/O remained high, so we kept investigating. Suspecting memory, we found the Amazon RDS best practices documentation. It explains that most of the working set—frequently accessed data and indexes—should fit in memory to maintain low read IOPS. AWS recommends increasing memory until further increases no longer cause a substantial drop in IOPS.
We measured the size of InnoDB data and indexes with this query:
SELECT FLOOR(SUM(data_length+index_length)/POWER(1024,2)) InnoDBSizeMB
FROM information_schema.tables WHERE engine='InnoDB';
Together, the user service’s data and indexes occupied 170 GB. With 32 GB of RAM on the existing RDS instance, we couldn’t easily determine what proportion of those 170 GB needed to fit in memory as the working set. Nevertheless, the team agreed that increasing memory was worth trying. We also considered how gp2 EBS characteristics affected IOPS burst depletion and decided to move to an instance better suited to our requirements.
We first switched from m5.2xlarge to the similarly priced, memory-optimized r6g.2xlarge, increasing memory from 32 GB to 61 GB. Read IOPS fell by more than half but remained high, so we scaled up again to r6g.4xlarge with 128 GB of memory. Its 20,000 IOPS capacity gave us ample room for our requirements. IOPS dropped steeply after the first change and more gradually after the second. Following the second upgrade, it settled at around 80 IOPS. We considered that sufficiently low and stopped scaling up.
Further improvements
The database instance now cost twice as much, so we needed to consider whether optimizing index size and other improvements could let us downsize. Comparing the performance and cost of alternative storage, such as DynamoDB, for the same requirements might also reveal opportunities.
We considered these other options for the increasing IOPS:
-
Increase storage. During the incident, we increased storage from 800 GB to 999 GB to address the gp2 burst IOPS situation and avoid additional charges. But continually buying unnecessary storage as IOPS grew did not seem like the right solution.
-
Add a read cache. We considered a cache such as Redis, but it would increase system complexity and require a plan for the burst of database traffic if the cache failed. Redis is fast because it operates in memory, but a sufficiently large MySQL buffer pool already handles most of the workload in memory. We therefore saw little additional benefit from introducing Redis.
Considering complexity and performance, scaling up to right-size the database was the most suitable solution for our current requirements.
Metrics after scaling up
Here are the actual database metrics after the two instance upgrades.
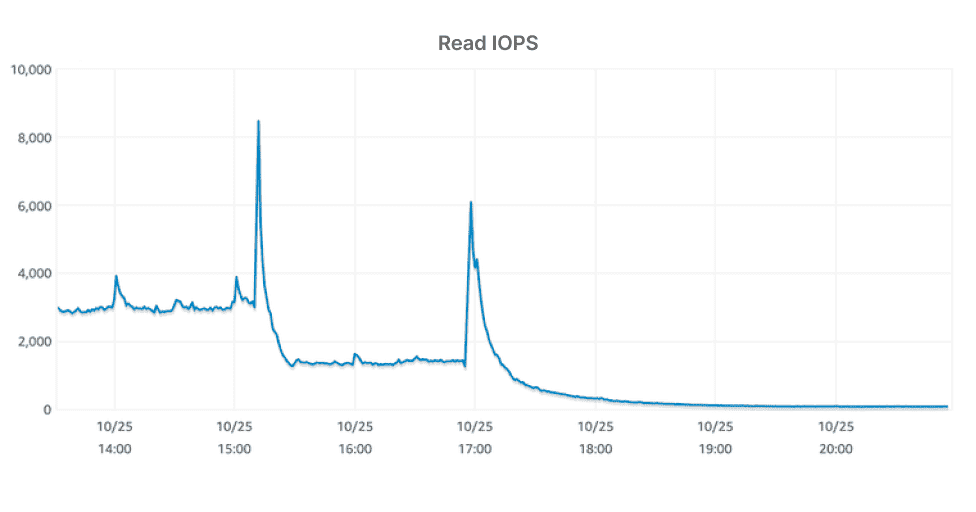
The two peaks in the read IOPS graph mark the instance replacements. IOPS fell from roughly 3,000 to below 2,000 after the first change, then to 80 after the second. That indicated we had found an appropriate memory size.

As expected after adding memory, freeable memory—previously approaching zero—had ample headroom following the two replacements.
 Read throughput changed dramatically too. With the buffer pool serving the required data, disk read throughput fell.
Closing thoughts
Memory issues like this are something you’re likely to encounter when operating a database. Memory size and disk IOPS may not seem connected at first, but this incident showed us how closely they can relate. If high read IOPS indicates that the working set isn’t sufficiently cached, adding memory can help.
In our case, the working set didn’t fit in memory, so scaling up solved the issue. Conversely, an unnecessarily large instance may offer an opportunity to save money by scaling down. I hope this post prompts you to revisit right-sizing and that our considerations about when and how to scale up help other teams. Thanks for reading. :)