AI-translated. Read the original in KoreanEmbedded slides, videos and images remain in their original language.
Improving Ad Budget Pacing, Part 1: Architecture and Observability

Software Engineer

Software Engineer

Introduction
Hello, we're Bale and Liam from the Ad Engine team. It is time for another look at the evolution of Buzzvil's advertising platform. We recently introduced how to build a horizontally scalable ad server. This time, we will discuss improvements to budget pacing, a capability just as important as the ad server itself.
Budget pacing distributes a campaign's allocated budget over its run to maximize advertising performance. Without it—or if it malfunctions—a campaign may spend its entire budget immediately after launch or experience sudden spending spikes. Spending everything in a short burst may bring users in quickly, but it cannot deliver optimal long-term performance and can reduce advertiser satisfaction.
Buzzvil's initial pacing logic was implemented as a command within the ad server. It evolved repeatedly to meet business requirements and is now a separate microservice that we continue to improve. In this series, we will share what we learned along the way.
Introducing the budget pacing system
First, let's see how pacing works within the advertising system.
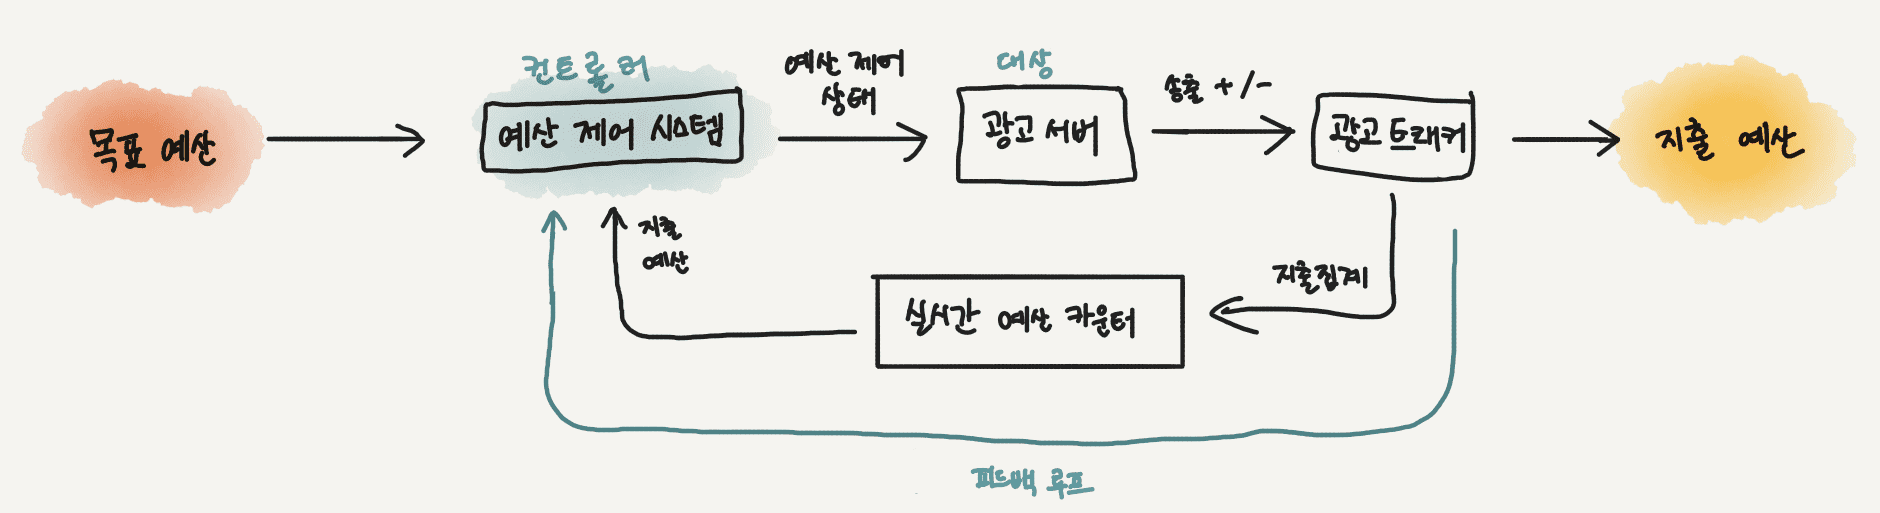
The pacing system compares actual spend so far with the planned spending rate, decides whether it is ahead or behind, and produces a “pacing state” that determines spending speed for the next cycle. The ad server uses that state to set each campaign's bidding frequency. More or fewer bids affect how often an ad is served, which speeds up or slows down spending. Simply put, the system slows spending when it is ahead of plan and accelerates it when it is behind. Because each cycle's state affects spending in the next cycle, this is a feedback system.
What the pacing system must consider
Assuming a campaign has enough eligible audience for its budget, it should neither exceed nor fall short of its daily or total allocation. To maximize performance, it must also avoid spending too quickly or too slowly. This kind of fine control requires three main considerations.
1. The campaign's current spending target
Budgets are distributed across several timescales. We must determine how much to allocate to each day of a campaign's run, then how much to spend each hour and minute. Spending an equal amount every hour is possible, but concentrating spend when more of the target audience is available should produce better conversion results. We therefore need to calculate minute-level spending targets in advance, considering traffic patterns and the proportion of traffic that actually matches the campaign's audience.
2. Spend so far, and spend that will arrive soon
A target alone is not enough; we need actual spend to compare against it. Between serving an ad and a user interaction generating a billable impression, click, or conversion, there may be a delay of seconds or even hours. There is also pipeline latency before those events are aggregated. Accurate pacing requires minimizing aggregation delays and predicting how much spend will arise from ads already served whose billable events have not yet occurred.
3. Choosing the pacing state
Think of pacing as a car's accelerator and brake. To stop at the intended point, a moving car must begin braking at the right time. Given target and actual spend, the pacing system must decide whether to accelerate or brake, and how strongly. Slamming on the brakes at high speed can cause a car to overshoot. Likewise, campaign spending must anticipate its endpoint and slow gradually to avoid overspending.
Our improvement journey
Initially, ad allocation, campaign management, and pacing all lived in a monolithic ad server. Impression and click events updated Redis, which recorded real-time spending state. A scheduled Jenkins command periodically compared actual and target spend for all active ads and paused or resumed campaigns. The simplified structure looked like this; most details are omitted.
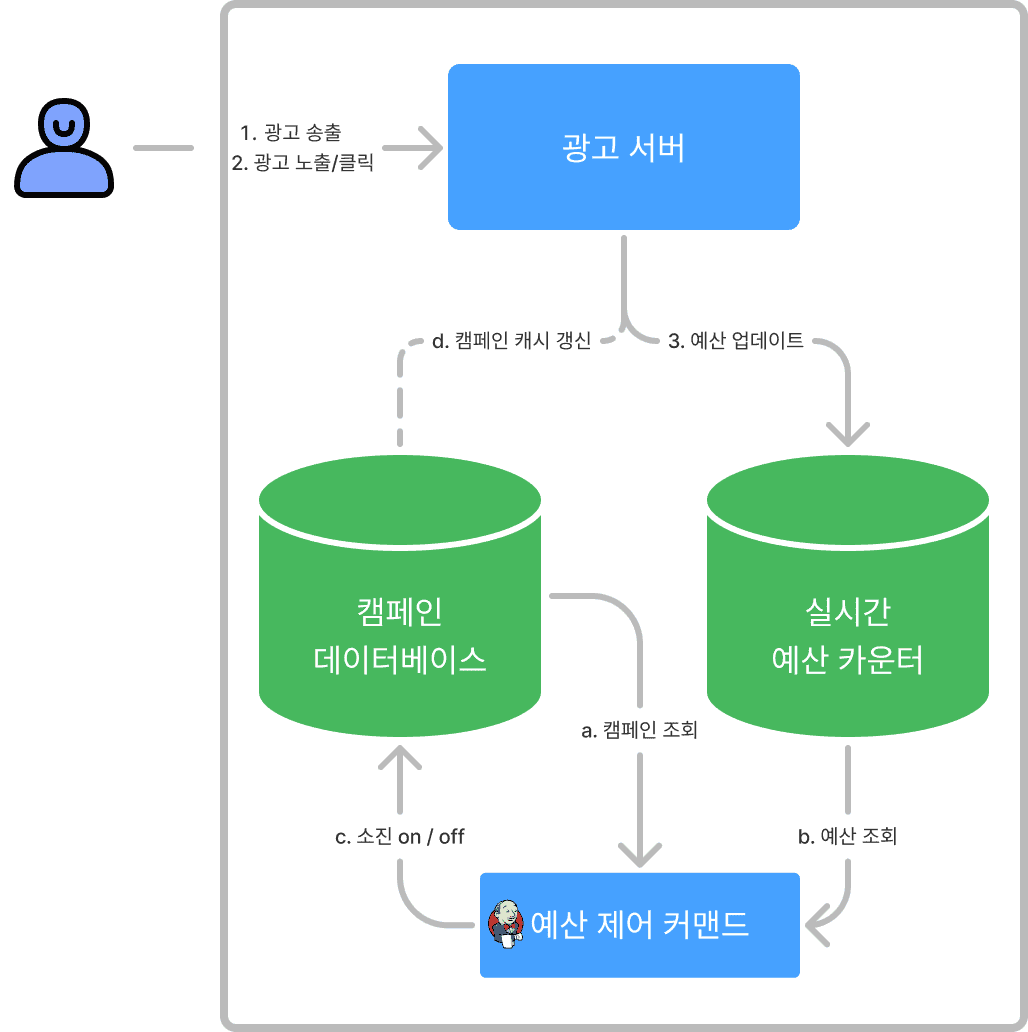
The system met our needs at the time, but as Buzzvil's campaign pool grew and ad products diversified, pacing logic needed to evolve. To reduce the complexity of that evolution, we decided to separate campaign metadata management from budget pacing. Their dependencies were too extensive for a single migration, so we proceeded in stages over roughly two and a half years.
Stage 1: move the existing logic into a separate microservice
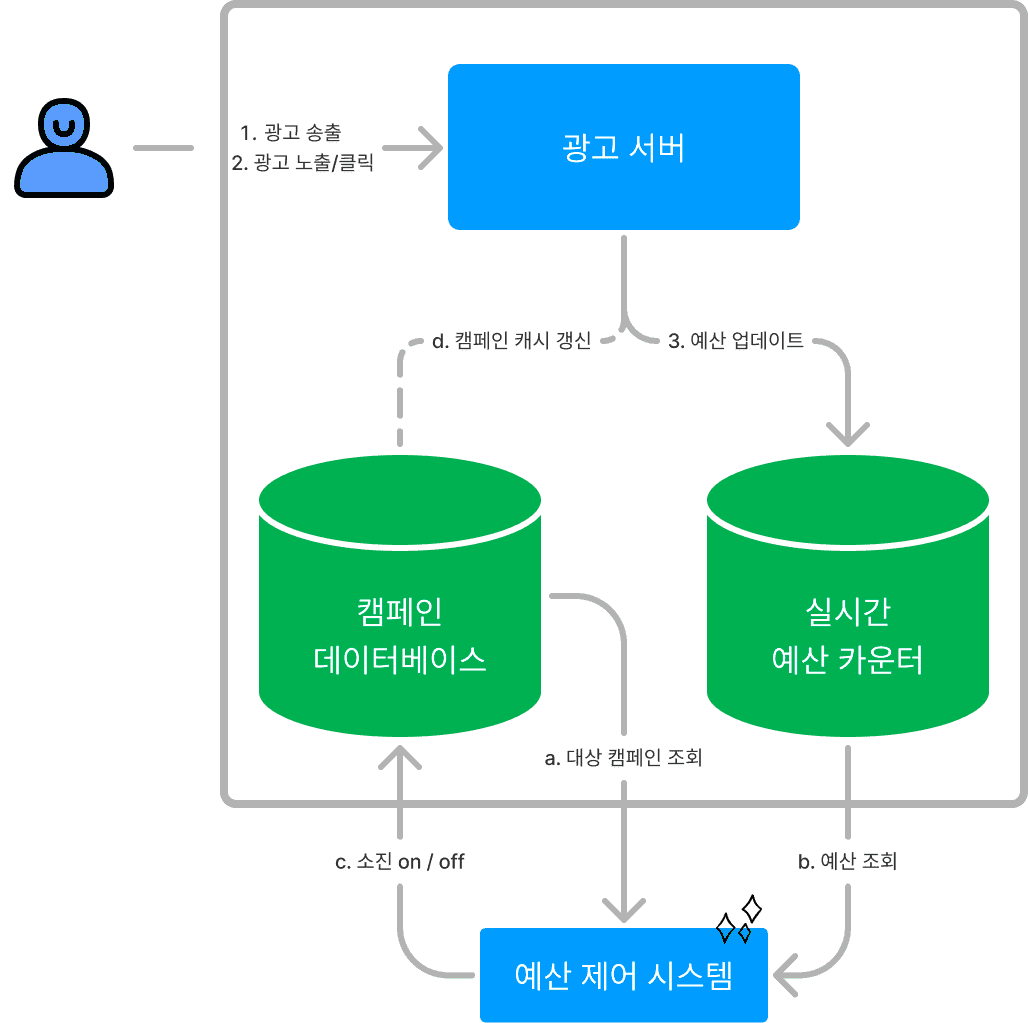
We judged that the Jenkins command would not meet future performance needs, and sharing the ad server's source code would create more structural complexity and inefficiency. We first extracted a separate microservice with the same functionality.
Instead of accessing the campaign database directly, the new service updated spending state through an API provided by the ad server. API calls introduced concerns such as network failures and additional latency. However, pacing tolerates some delay and periodically derives a fresh state from current conditions, so eventual consistency was sufficient for the separation.
The new microservice gave us clearer boundaries and ownership. We could also freely add capabilities such as APM and Prometheus monitoring—tools we had not been able to use with the Jenkins command—to make the service observable.
Stage 2: separate ad serving and implement a statistics system
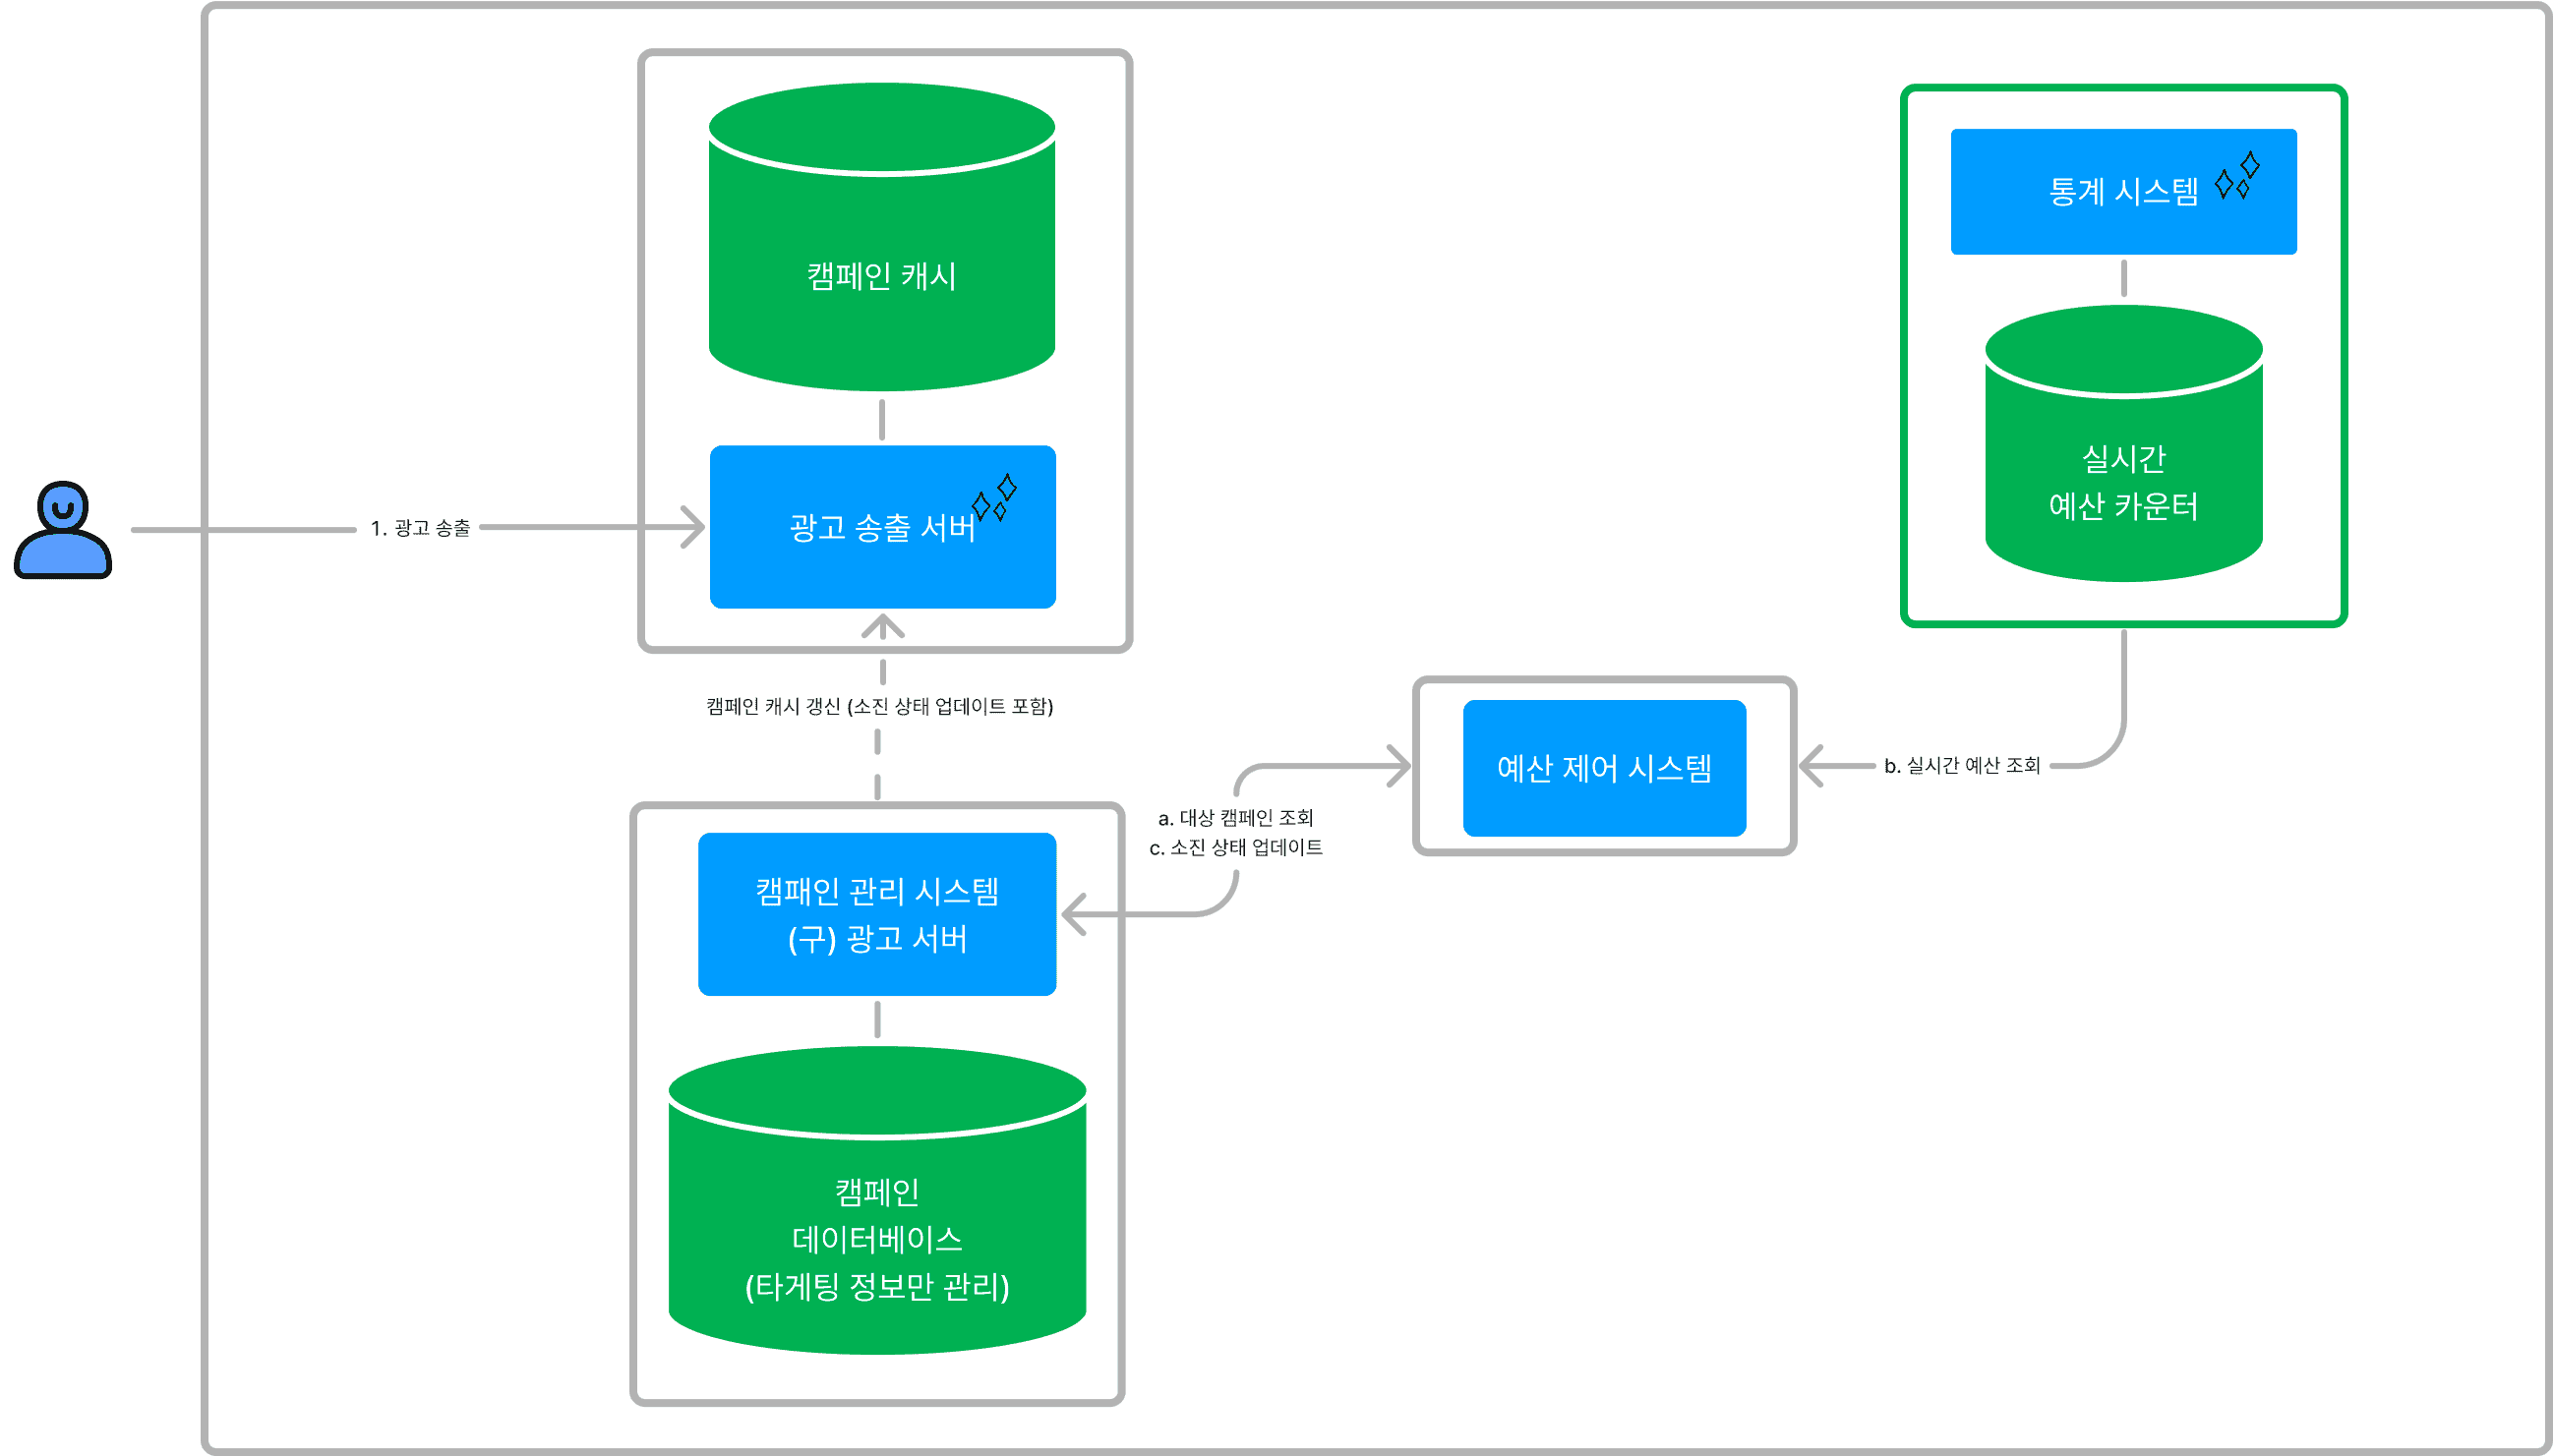
The monolithic ad server handled not just serving, but campaign management, spend aggregation, and more. Performance and complexity concerns led us to extract ad serving and spend statistics into separate microservices. There are many interesting stories in that process too, but they go beyond budget pacing, so we hope to cover them another time.
Stage 3: implement an ad event tracker and aggregation pipeline
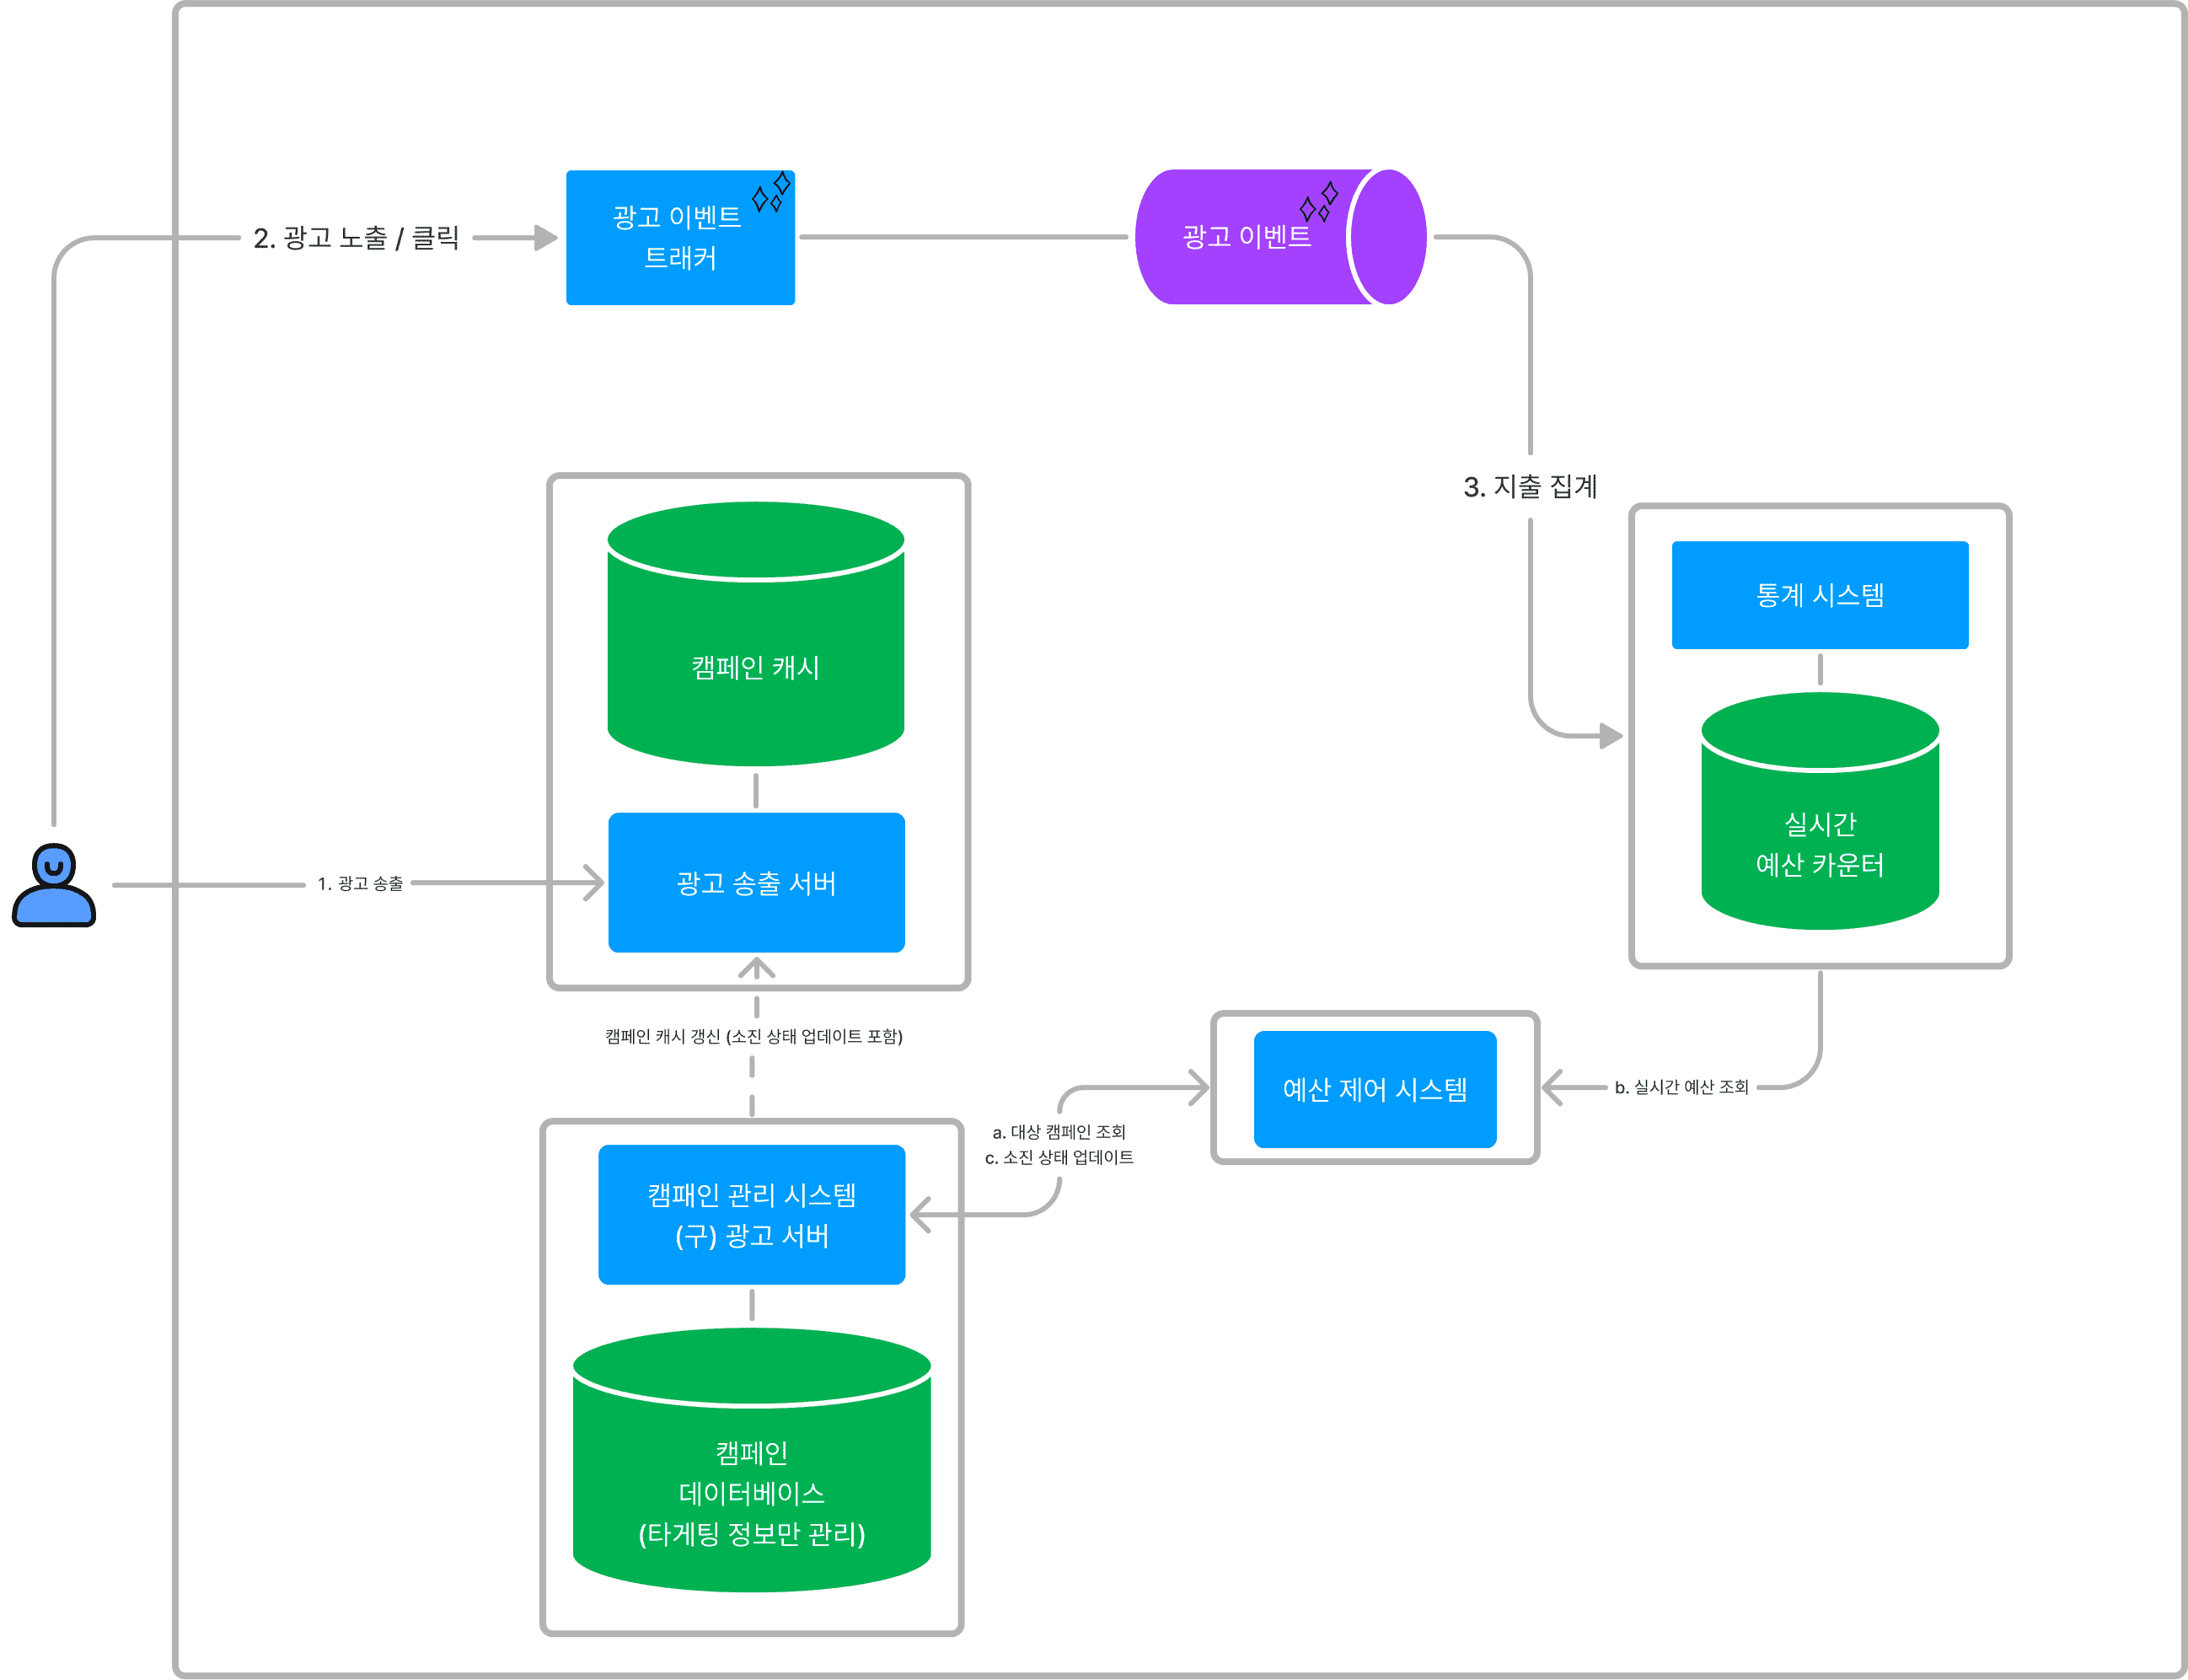
As explained earlier, pacing uses aggregated spending information and campaign budget settings to distribute spend as intended. It depends heavily on the stability and latency of the aggregation pipeline. Several legacy systems had become entangled in that pipeline, making it difficult to manage. We optimized it using Kafka, which the company was adopting at the time. This stabilized aggregation, reduced delays, and ultimately allowed us to shorten the pacing cycle substantially.
Stage 4: separate pacing state from the campaign model
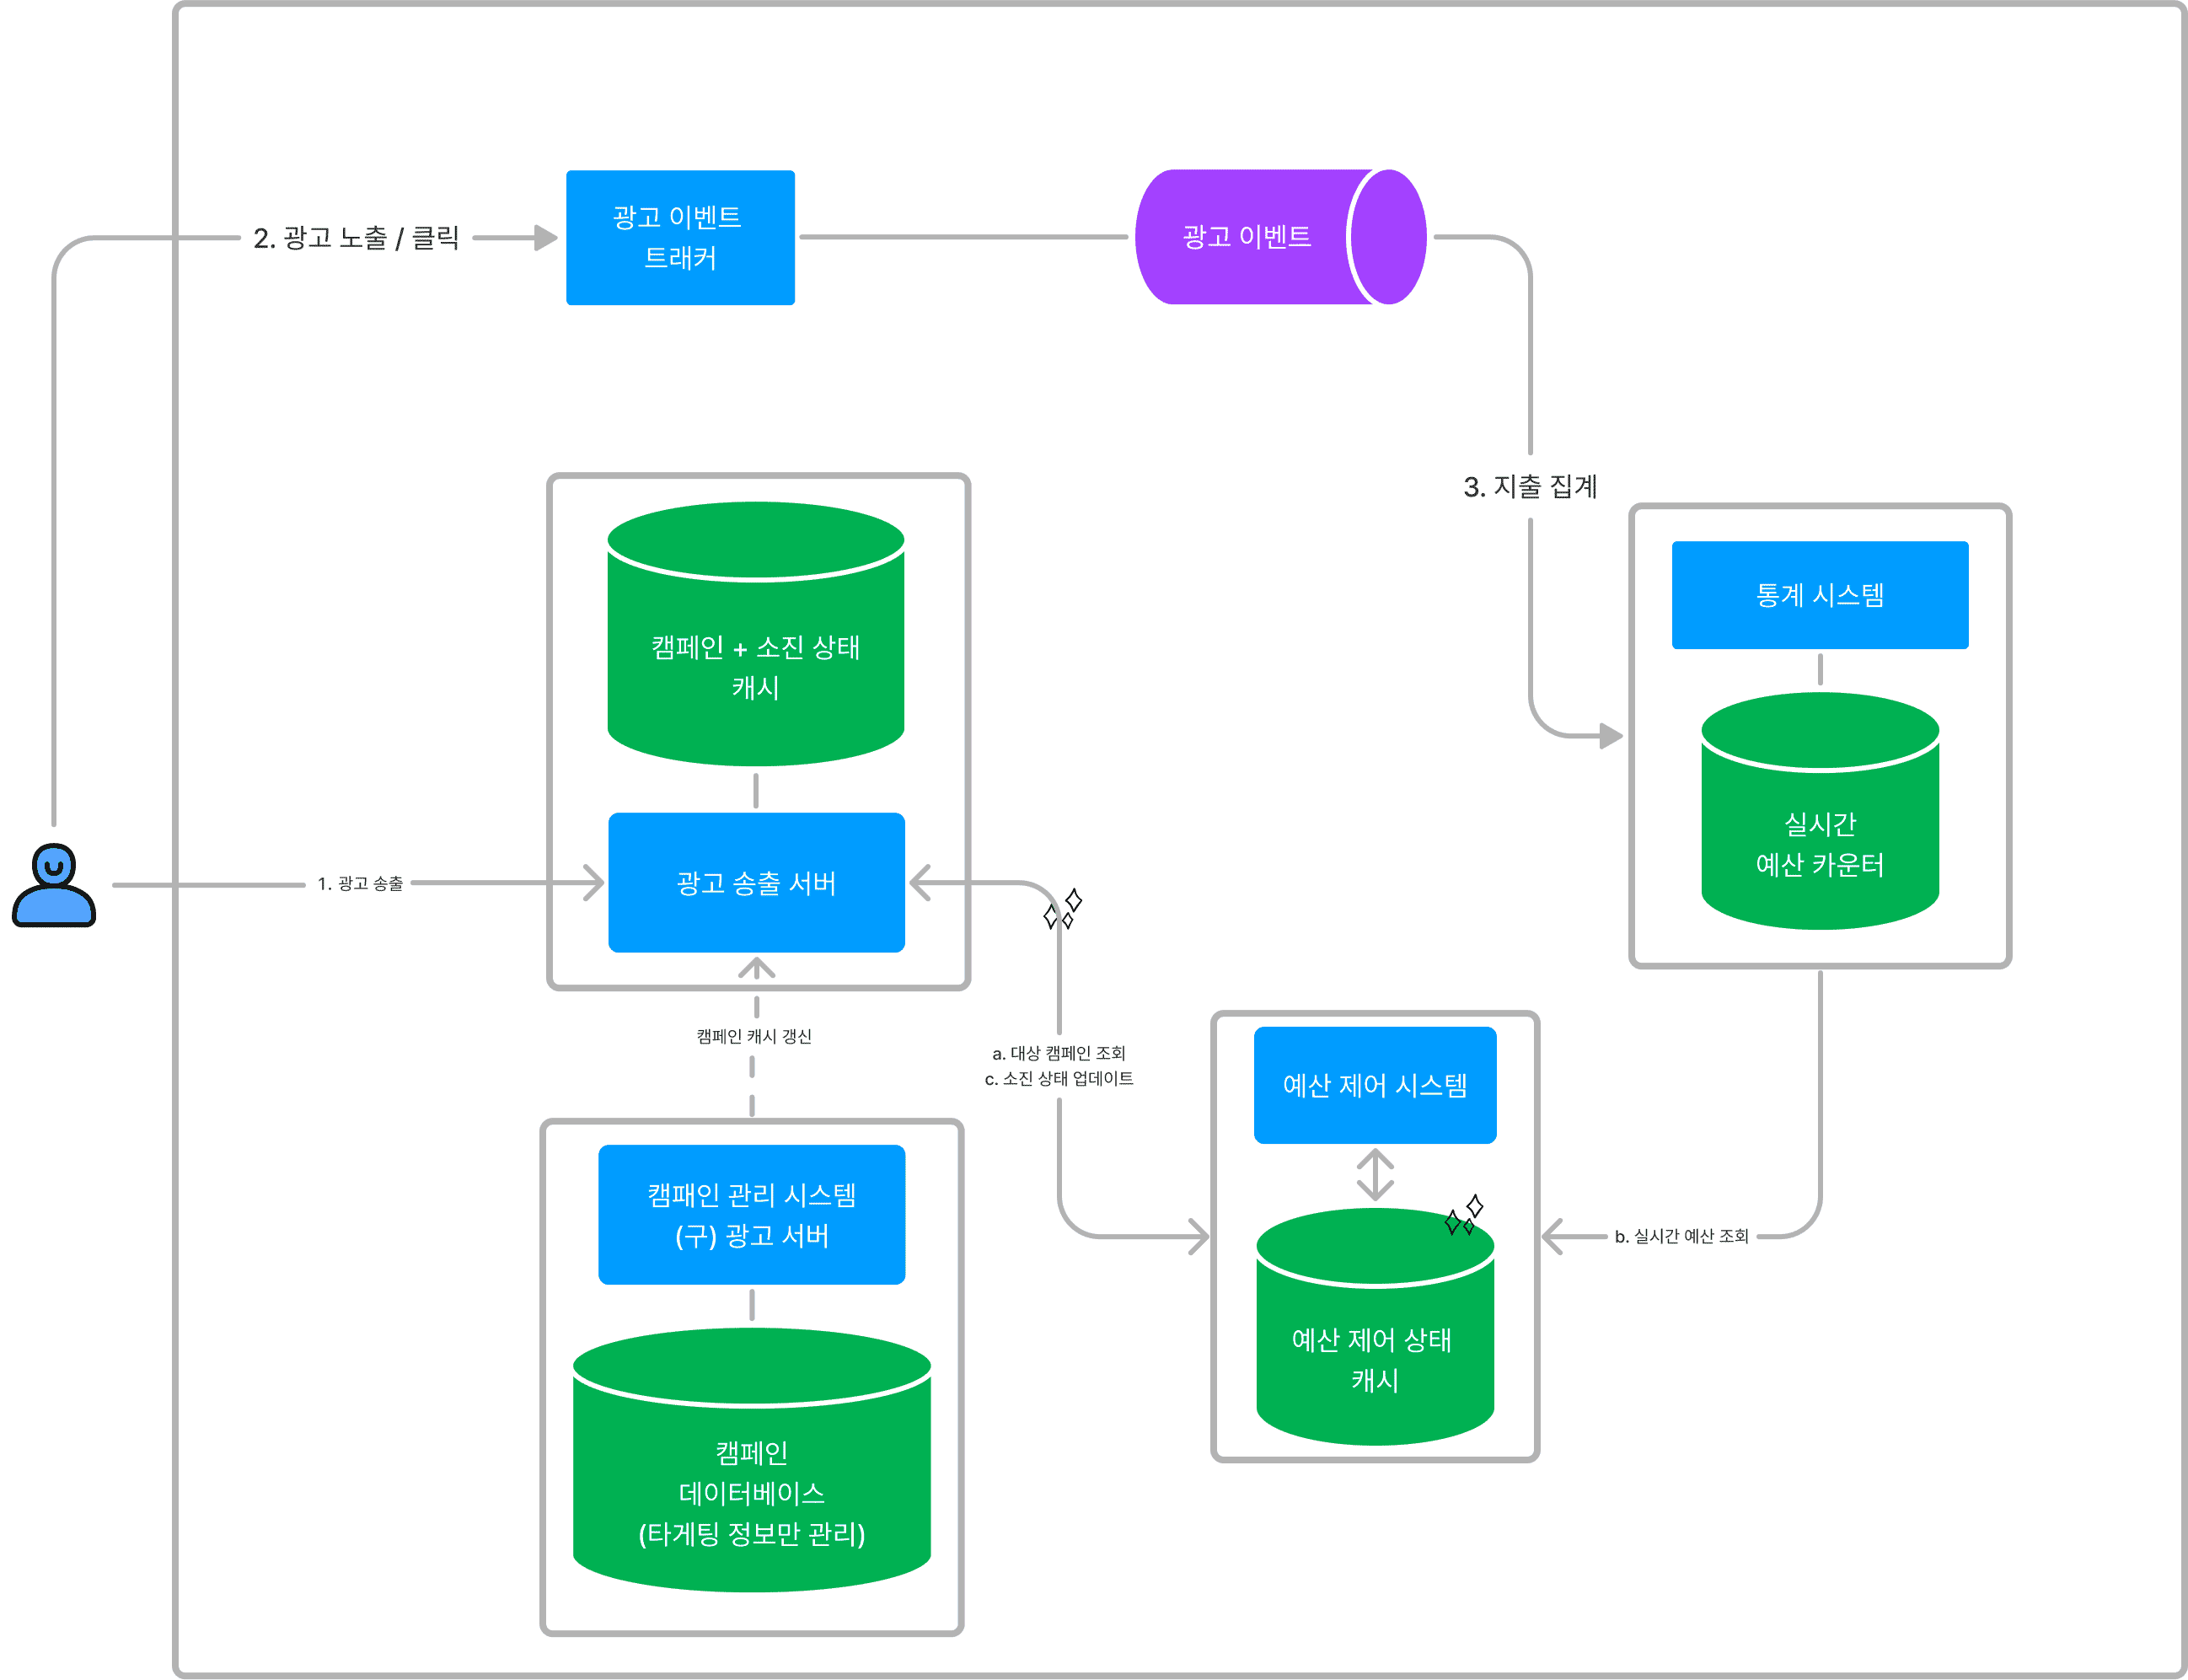
We had extracted the pacing command and gained visibility, but one issue still held us back: pacing state remained a property of the campaign model. Every state change therefore required a campaign update. That may not sound serious, but pacing ran once a minute for every active campaign. Each campaign record had to update every minute, even though most of its metadata—budget settings, targeting, frequency limits, and so on—changed only once or twice a day at most.
To solve this, we finally needed to remove pacing state from the campaign database. We first implemented a persistent pacing-state model in the pacing service. Then, in preparation for removing it from campaign management, we synchronized that state directly into the ad-serving server's campaign cache. Finally, we removed the state from the campaign management system.
The benefits may not be immediately obvious. Functionally, we reduced load on the campaign database. Structurally, separating the models made them easier to change and extend. Synchronizing pacing state directly to the ad cache also removed the two-component propagation path, reducing failure points and improving reliability.
That covers the component-level journey. Later, as we enhanced pacing functionality, we felt the benefits of this structural work and translated them into business results. It was a rewarding experience that I am eager to share, but first let's discuss the observability that helped our team move faster.
Making the system observable
Budget pacing is a control-loop feedback system, so the results of decisions arrive later. That makes the impact of an algorithm change difficult to assess immediately. We could previously analyze impression and click patterns after the fact, but it was hard to understand intuitively what information the pacing system had used and why it made each decision.
Testing a hypothesis required changing the algorithm, asking the ad operations team to allocate some budget for an experiment, and waiting until the next day for results. Interpreting those results then required many assumptions.
We realized that iterative improvement would take far too long this way, so we began making the system's behavior visible. For every campaign in every pacing cycle, we logged the current spending target, actual spend, and the resulting pacing state. We sent those logs to our data lake and analyzed them through a BI tool.
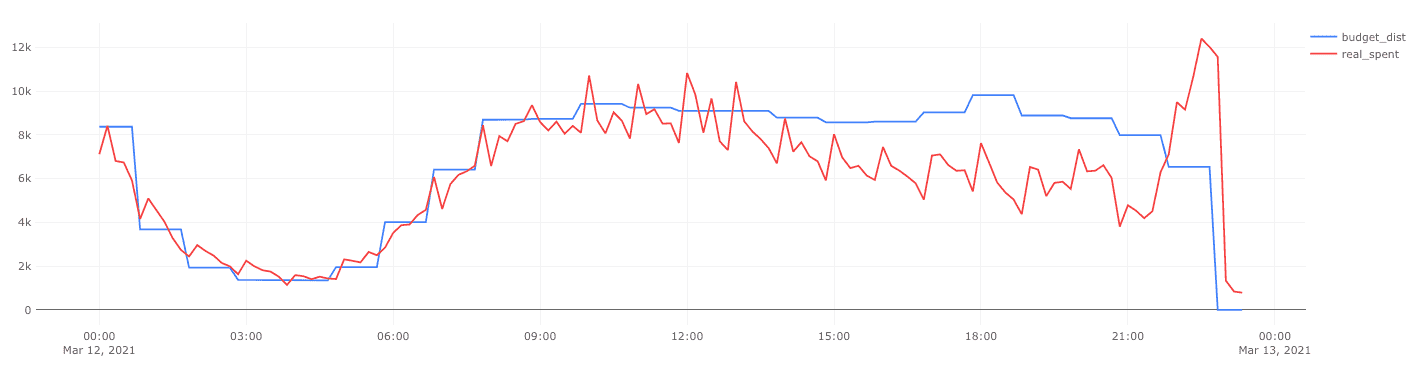
We could now see how the budget had been planned and how the algorithm controlled actual spending, making the behavior much easier to understand. Better visibility let us examine a wider range of hypotheses at the same time.
Once we saw how important observability was to rapid validation, we decided to strengthen it further. There was a delay before data became available in the analytics system, and the BI tool was not fully flexible for exploration. We considered deriving metrics from logs or collecting them directly from the application, then chose Prometheus for its real-time capabilities.
With Prometheus and Grafana, we could monitor actual spend and pacing state in real time. After changing the algorithm for an experiment, we could immediately see the effects and respond to problems. This gave us much more confidence.
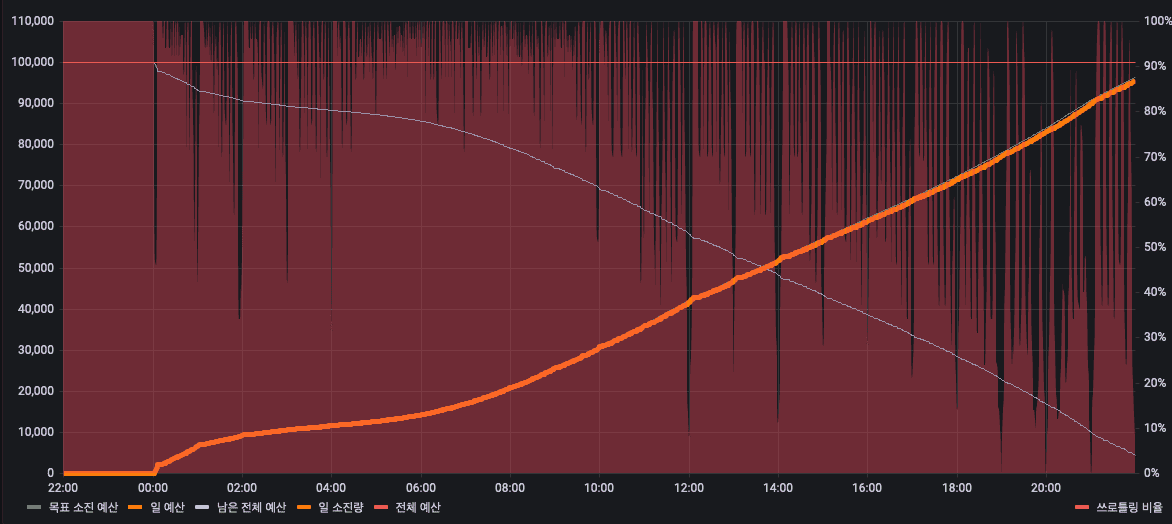
Having experienced the value, the team began collecting business metrics in a TSDB alongside system metrics and APM. Previously, we shared a company-wide Prometheus cluster, which made us cautious about high-cardinality metrics. The DevOps team provided an easy way to operate a single-tenant Prometheus + Thanos stack per microservice, letting each service collect metrics freely.
As an aside, logs and metrics often observe the same domain events. When adding metrics, we refactored existing logging points using the Domain Probe pattern to organize instrumentation code.
We do not need to measure everything, but collecting and examining metrics for important domain events greatly improved our understanding.
In the next installment, we will explain the longer-term impact that these architectural and observability improvements had on our product and business.